Trading Diary
October 30, 2004
These extracts from my daily trading diary are for educational
purposes and should not be interpreted as investment advice. Full
terms and conditions can be found at Terms
of Use.
USA
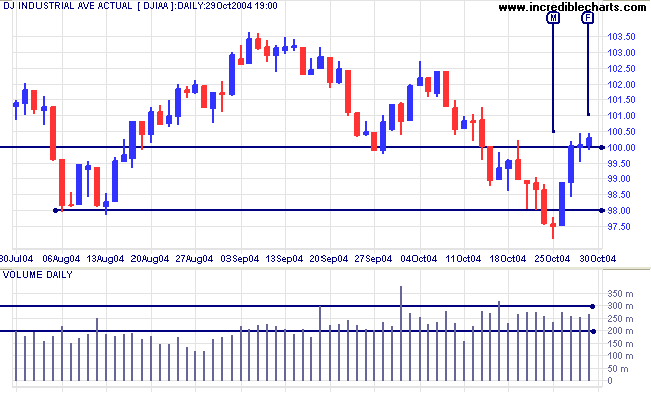
The Dow Industrial Average completed a false break below support at 9800 before rallying strongly. Last Friday closed down strongly but Monday [M] gave the first warning of a reversal with a weak close on lower volume. This was followed by a rally back to 10000. Momentum has since faded with smaller bars on average volume. Consolidation above this level would signal a test of the upper border of the consolidation pattern in the short to medium term.
The Dow Industrial Average completed a false break below support at 9800 before rallying strongly. Last Friday closed down strongly but Monday [M] gave the first warning of a reversal with a weak close on lower volume. This was followed by a rally back to 10000. Momentum has since faded with smaller bars on average volume. Consolidation above this level would signal a test of the upper border of the consolidation pattern in the short to medium term.
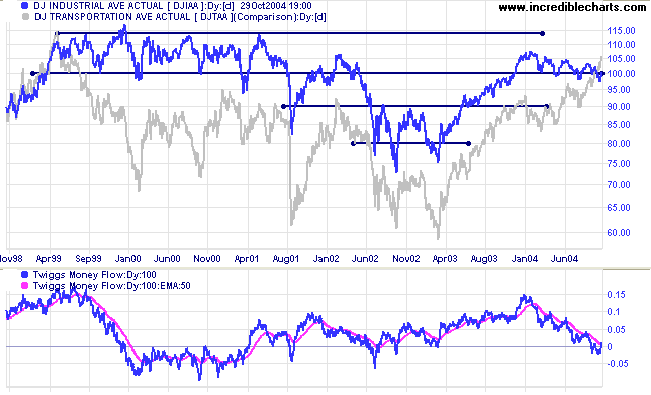
On the longer-term chart we can see that the 
Dow Jones Transportation Average has resumed a strong primary up-trend; possibly signaling that the Industrial Average will follow suit.
Twiggs Money Flow has crossed above its signal line but it is too early to read this as a bull signal.
Dow Jones Transportation Average has resumed a strong primary up-trend; possibly signaling that the Industrial Average will follow suit.
Twiggs Money Flow has crossed above its signal line but it is too early to read this as a bull signal.
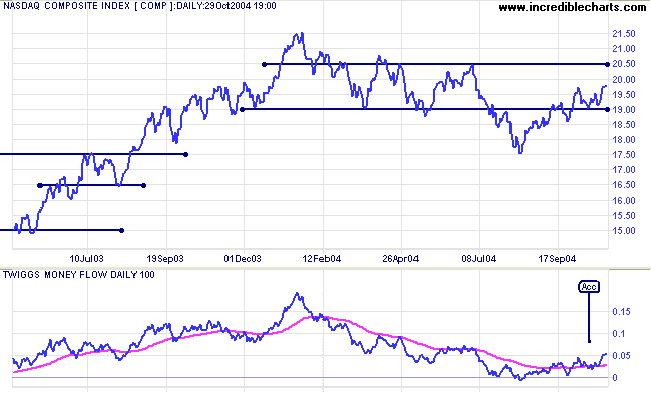
The Nasdaq Composite index has consolidated above support
at 1900 and may be preparing for a breakout.
The primary trend remains downward but the pull-back above the first line of resistance (at 1900) indicates a weak trend.
Twiggs Money Flow signals accumulation, with a trough [Acc] at the signal line.
The primary trend remains downward but the pull-back above the first line of resistance (at 1900) indicates a weak trend.
Twiggs Money Flow signals accumulation, with a trough [Acc] at the signal line.
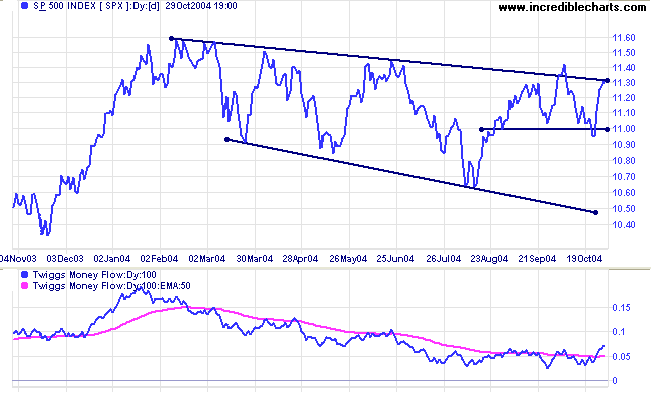
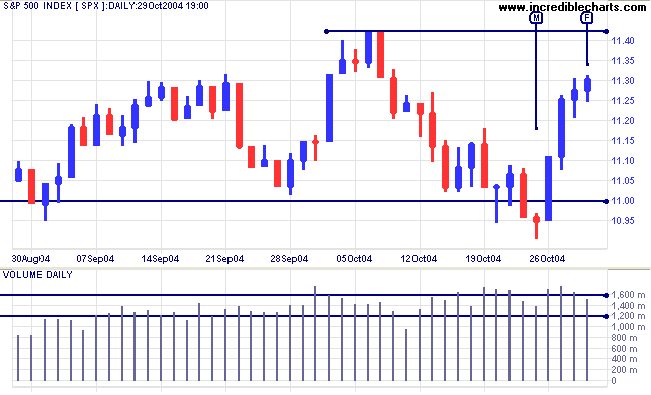
The S&P 500 displays a broadening (descending) wedge.
These are bullish patterns with roughly a 2:1 success rate
(Thomas Bulkowski: Encyclopedia of Chart Patterns), ending
with a continuation of the prevailing trend. The index has
reversed back above 1100, giving an early bull signal.
Twiggs Money Flow jumped sharply above its signal line, signaling accumulation.
Twiggs Money Flow jumped sharply above its signal line, signaling accumulation.
The break below the 1100 support level, last Friday, proved to be
a false break. Monday gave the first warning, with a very weak
close, followed by a strong rally on Tuesday accompanied by heavy
volume. The rally has petered out towards the end of the week,
with smaller bars and lower volume, but should consolidate or
make a small correction before testing resistance at 1142. A
break above 1142 would be bullish while a pull-back after the
breakout, that respects the new support level, would be a strong
signal.
|
|
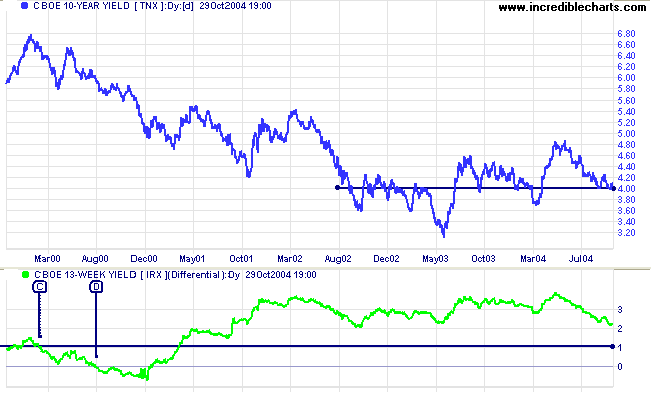
Treasury yields
The yield on 10-year treasury notes is flirting with support at 4.00%. The pattern appears weak and a downward breakout likely.
The yield differential (10-year T-notes minus 13-week T-bills) is falling. Differentials below 1.0% (as at [C]) are (long-term) bear signals, while a fall below zero (as at [D]) is a stronger signal.
Gold
New York: Spot gold is testing resistance at$430, closing at $428.20 on Friday.
The primary trend is up. The short pull-back below the resistance level is a bullish sign.
New York: Spot gold is testing resistance at$430, closing at $428.20 on Friday.
The primary trend is up. The short pull-back below the resistance level is a bullish sign.
|
ASX Australia
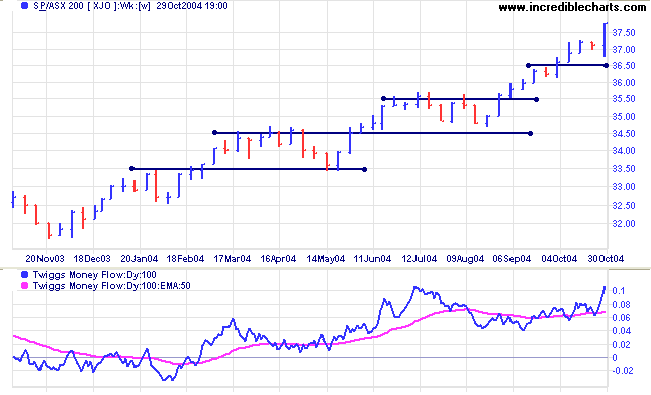
The ASX 200 made a false break below support on Monday [M]. This was quickly reversed the following day on strong volume. Most false breaks only last a day: if we wait for the close on the second day, most of these traps can be avoided. Reversal of a false break, especially when accompanied by heavy volume, is a short-term bull signal similar to the longer-term bear trap.
The subsequent strong rally ended with an inside day on Friday [F]. This formed a compressed spring pattern (narrow range and strong volume), warning of a big move in the week ahead. The strong close indicates that the breakout should be in an upward direction. A rise above 3780 would confirm, while a fall below 3760 (half-way down the previous bar and below Friday's low) would be bearish. A reversal would likely re-test support at 3700, while a rally would likely gain another 60 to 70 points.
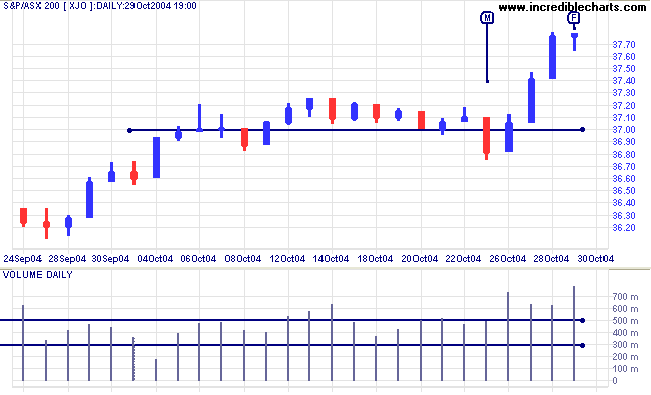
Twiggs Money Flow is rising steeply, signaling strong
accumulation.
The primary up-trend is strong. We should, however, allow for a correction that will test support at 3500 (the highs from 2002) in the longer-term.
The primary up-trend is strong. We should, however, allow for a correction that will test support at 3500 (the highs from 2002) in the longer-term.
Incredible Charts - New
Search
Please remember to set a Default Exchange for the Securities
toolbar and Search function:
Back Issues
- Go to Securities >> Set Default Exchange on the chart menu
- Select the exchange that you use most frequently
- For other exchanges, you will need to enter a two-digit
exchange code after the security code
Examples: msft nq and bhp ax
(codes can also be entered with an underscore: msft_nq and bhp_ax) - No exchange code is required for the default exchange.
Exchange codes:
|
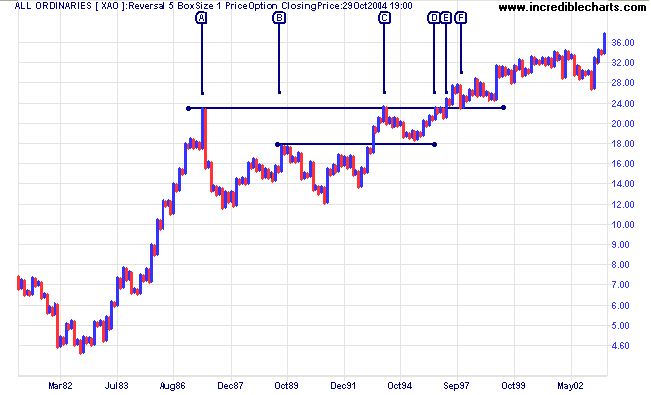
Point & Figure Charts: Cup and
Handle
The cup and handle pattern was popularized by
William J O'Neil (How to Make Money in Stocks).
Criteria for the pattern are:
Criteria for the pattern are:
- The pattern must occur in an up-trend; and
- The handle should not be more than half the depth of the cup.
- The cup runs from 1987 [A] to 1994 [C]; and
- The handle runs from [C] until the breakout in 1997 at [E].
Some observations:
- The handle pulls back less than half-way, respecting support at the mid-point of the cup [B];
- There is a brief consolidation [D] to [E] below the major resistance level: a bullish sign ahead of the breakout;
- The breakout at [E] is immediately followed by a pull-back to test the new support level; and
- A further, longer-term pull-back follows 8 months later at [F].
For further assistance, read About
the Trading Diary.
Colin Twiggs
Markets are constantly in a state of
uncertainty and flux
and money is make by discounting the obvious
and betting on the unexpected.
~ George Soros
and money is make by discounting the obvious
and betting on the unexpected.
~ George Soros
Back Issues
Access the Trading Diary Archives.

Author: Colin Twiggs is a former investment banker with almost 40 years of experience in financial markets. He co-founded Incredible Charts and writes the popular Trading Diary and Patient Investor newsletters.
Using a top-down approach, Colin identifies key macro trends in the global economy before evaluating selected opportunities using a combination of fundamental and technical analysis.
Focusing on interest rates and financial market liquidity as primary drivers of the economic cycle, he warned of the 2008/2009 and 2020 bear markets well ahead of actual events.
He founded PVT Capital (AFSL No. 546090) in May 2023, which offers investment strategy and advice to wholesale clients.