| Incredible Charts Version 4.0.3.800 now available. |
|
Your version of Incredible Charts should update
automatically when you next login. If you do not receive the update, check Help >> About on the charts menu for the version. Then read Troubleshooting : Live Update. |
Trading Diary
October 23, 2004
These extracts from my daily trading diary are
for educational purposes and should not be interpreted as
investment advice. Full terms and conditions can be found at
Terms
of Use.
USA
The Dow Industrial Average exhausted support at 9800, closing down strongly on average volume. If the index fails to consolidate or cross back above 9800 in the next few days, this will be a strong bear signal. Each of the previous down-swings has reversed shortly after making a new low. Failure to do so would signal increased commitment from sellers.
The Dow Industrial Average exhausted support at 9800, closing down strongly on average volume. If the index fails to consolidate or cross back above 9800 in the next few days, this will be a strong bear signal. Each of the previous down-swings has reversed shortly after making a new low. Failure to do so would signal increased commitment from sellers.
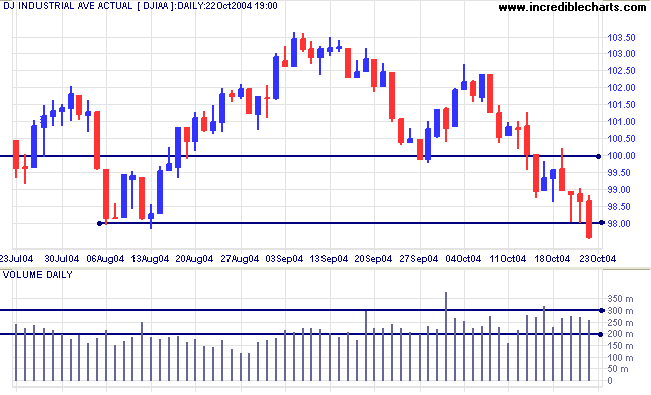
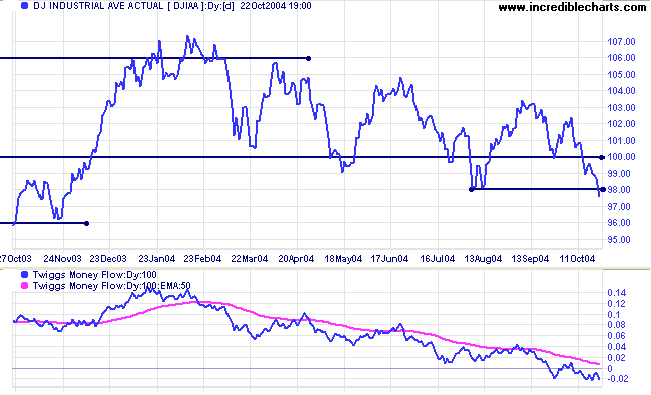
Some readers may interpret the consolidation pattern below as a
bullish
descending wedge, but the pattern has not narrowed to a
point. There is still chance of an upward breakout, but
Twiggs Money Flow is falling sharply, signaling strong
distribution. An intermediate reaction that fails to recover
above 10000 would be a long-term bear signal.
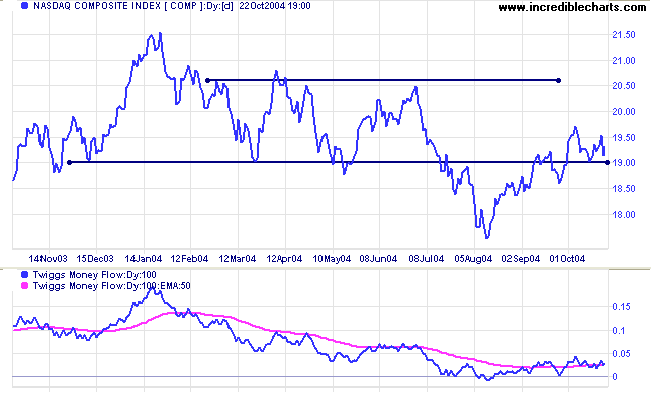
The Nasdaq Composite index has so far held above support
at 1900. A rise above the recent peak at 1970 would be a bullish
sign, while a break below 1900 would be bearish.
The primary trend remains downward. The pull-back above the first line of resistance (at 1900) indicates a weak trend.
Twiggs Money Flow continues to whipsaw around the signal line, reflecting indecision.
The primary trend remains downward. The pull-back above the first line of resistance (at 1900) indicates a weak trend.
Twiggs Money Flow continues to whipsaw around the signal line, reflecting indecision.
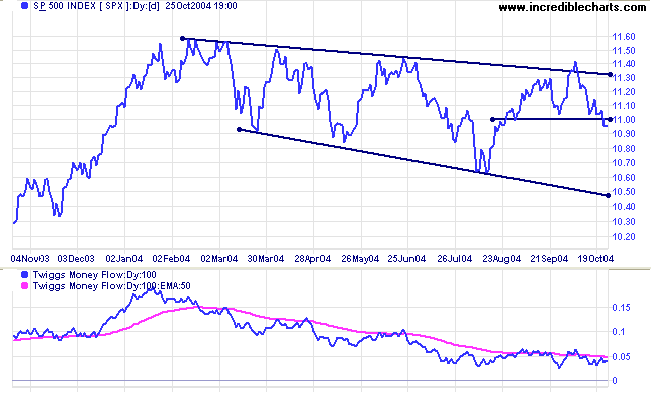
The S&P 500 failed to hold above support at 1100,
breaking through after strong volume on Tuesday to Thursday. If
there is no immediate recovery, expect a test of support at the
previous low of 1060.
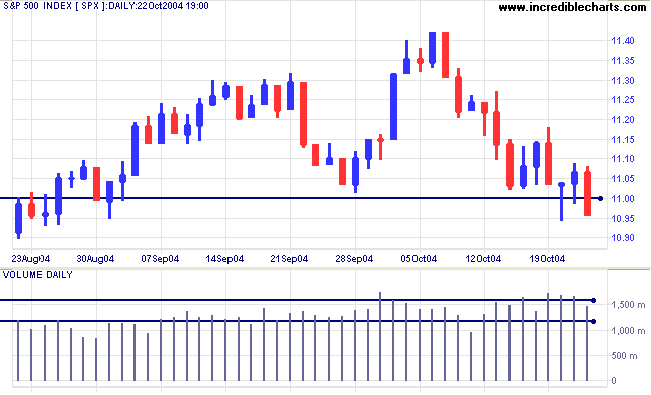
The long-term consolidation displays a broadening (descending)
wedge. These are bullish patterns with roughly a 2:1 success rate
(Thomas Bulkowski: Encyclopedia of Chart Patterns), ending
with a continuation of the prevailing trend. Reversal back
above 1100 would be a strong bull signal.
However, Twiggs Money Flow is still bearish, remaining below its signal line.

It is also advisable to backup your key projects and watchlists to another disk on a regular basis.
Use File >> Import Files to restore files to your computer.
However, Twiggs Money Flow is still bearish, remaining below its signal line.
|
|
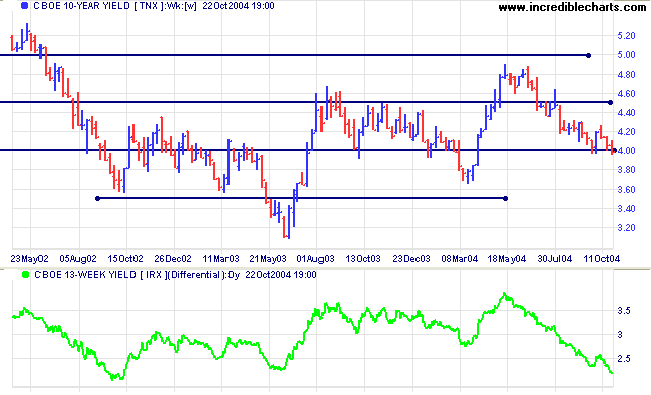
Treasury yields
The yield on 10-year treasury notes is again testing support at 4.00%, closing just below the key level. The market appears to be betting that surging oil prices will obviate the need for continued interest rate hikes.
The yield differential (10-year T-notes minus 13-week T-bills) continues to fall. Differentials below 1.0% are long-term bear signals.
Gold
New York: Spot gold is close to the 10-year high, closing at $424.00 on Friday.
The primary trend is up. Expect resistance between the 10-year high of $427.25 and $430.
New York: Spot gold is close to the 10-year high, closing at $424.00 on Friday.
The primary trend is up. Expect resistance between the 10-year high of $427.25 and $430.
|
ASX Australia
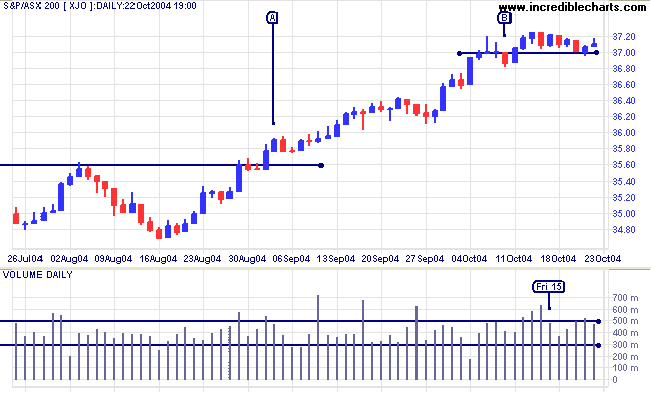
Last Friday's compressed spring pattern on the All Ordinaries was a false signal, caused by exceptional volume in Multiemedia [MUL], a stock that trades at below 4 cents a share. For that reason I have switched to the ASX 200 [XJO]: to minimize volume distortions from low-priced stocks. The ASX 200 includes only 10 stocks priced under a dollar, whereas the All Ords has more than 100.
The ASX 200 is consolidating in a narrow range above 3700, reflecting uncertainty from world markets. There is still plenty of buying support, as evidenced by high volumes on Wednesday and Thursday, but Friday's weak close indicates that this may be weakening. Two consecutive closes below 3700 would be a short-term bear signal (most false breaks, such as at [B], last only one day). Consecutive closes above the recent high, on the other hand, would be a bull signal, as at [A] in September.
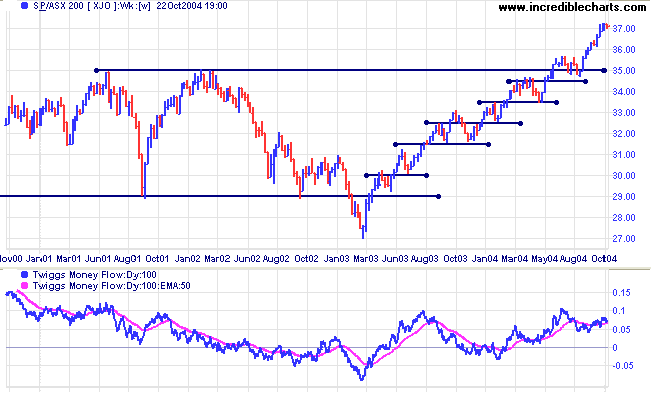
Twiggs Money Flow is rising, signaling accumulation.
The primary up-trend is strong. We should, however, allow for a correction that will test 3500 in the longer-term.
The primary up-trend is strong. We should, however, allow for a correction that will test 3500 in the longer-term.
Incredible Charts - Projects and
Watchlists
Many members appear to be unaware that projects and watchlists are stored on their own computer and cannot be accessed from anywhere else. To transfer files to another computer:
Watchlists have the extension .viz
Many members appear to be unaware that projects and watchlists are stored on their own computer and cannot be accessed from anywhere else. To transfer files to another computer:
- Select Files >> Export Files
- Select the required files
- Then save them to a removable disk (floppy disk or CD)
Watchlists have the extension .viz
It is also advisable to backup your key projects and watchlists to another disk on a regular basis.
Use File >> Import Files to restore files to your computer.
Incredible Charts - New
Version
The latest version features a new option at View >> Advanced Options >> Securities Menus Sorted By Sector.
Users can elect to display securities menus in either:
The new version also offers more options under View >> Advanced Options >> Set Menu Length.
The latest version features a new option at View >> Advanced Options >> Securities Menus Sorted By Sector.
Users can elect to display securities menus in either:
- alphabetical; or
- sector format.
The new version also offers more options under View >> Advanced Options >> Set Menu Length.
For further assistance, read About
the Trading Diary.
Colin Twiggs
Chance favors the informed mind.
~ Louis Pasteur
~ Louis Pasteur
Back Issues
Access the Trading Diary Archives.

Author: Colin Twiggs is a former investment banker with almost 40 years of experience in financial markets. He co-founded Incredible Charts and writes the popular Trading Diary and Patient Investor newsletters.
Using a top-down approach, Colin identifies key macro trends in the global economy before evaluating selected opportunities using a combination of fundamental and technical analysis.
Focusing on interest rates and financial market liquidity as primary drivers of the economic cycle, he warned of the 2008/2009 and 2020 bear markets well ahead of actual events.
He founded PVT Capital (AFSL No. 546090) in May 2023, which offers investment strategy and advice to wholesale clients.