Trading Diary
October 16, 2004
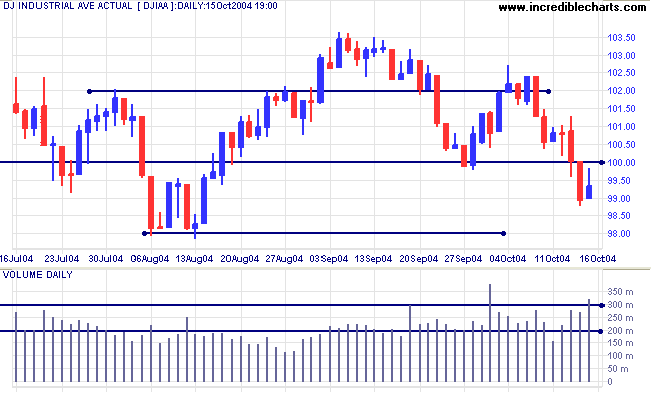
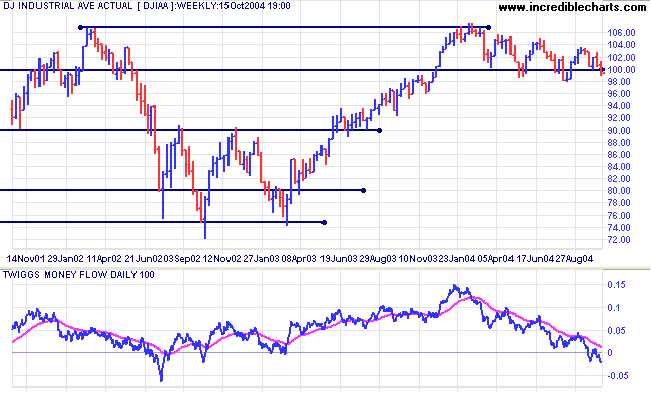
The Dow Industrial Average has slipped below support at 10000. Friday's weak close and strong volume signal that sellers are dominant. Expect a test of support at 9800. A break below 9800 followed by a successful test of resistance at 10000 would confirm that the primary trend has reversed downwards.
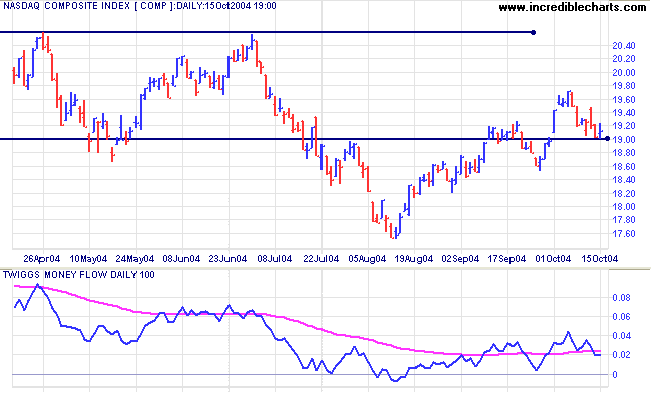
The primary trend remains downward. The pull-back above the first line of resistance (at 1900) indicates a weak trend.
Twiggs Money Flow continues to whipsaw around the signal line, reflecting indecision.
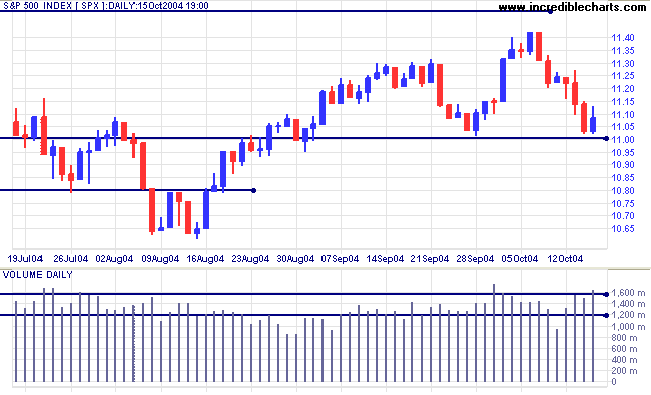
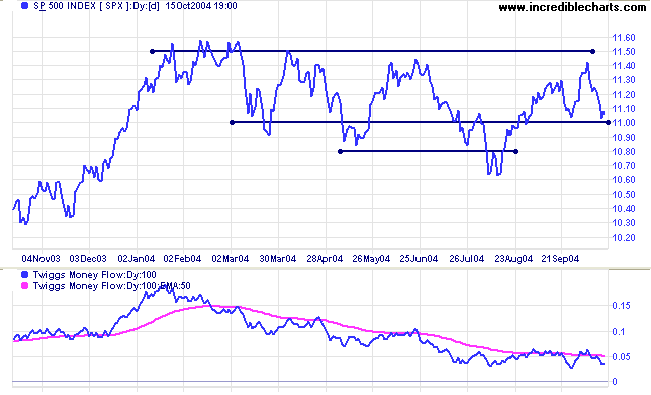
The long-term consolidation around 1100 reflects continued indecision. Another trough that respects the support level would be a bullish sign. Penetration of 1100, followed by a pull-back that respects that level, would be a bear signal.
|
|
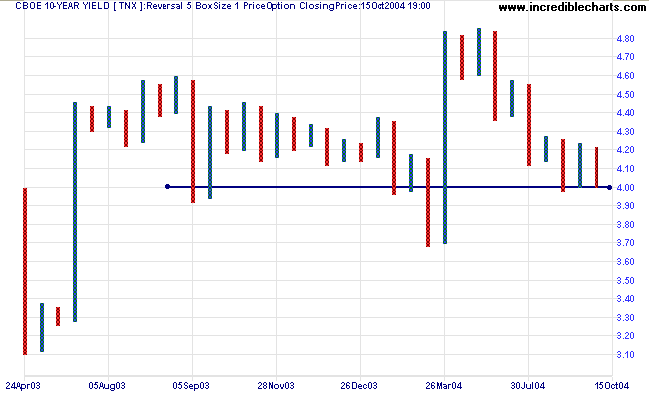
The yield on 10-year treasury notes is again testing support at 4.00%. The longer that yields consolidate above the support level, the greater the likelihood of a downward breakout.
The yield differential (10-year T-notes minus 13-week T-bills) eased to 2.3%. Differentials below 1.0% are long-term bear signals.
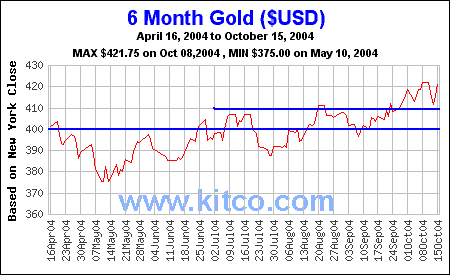
New York: Spot gold completed another successful test of support at $410, rallying to $418.40 by Friday.
Gold is in a primary up-trend. Expect resistance at the 10-year high of $427.25.
|
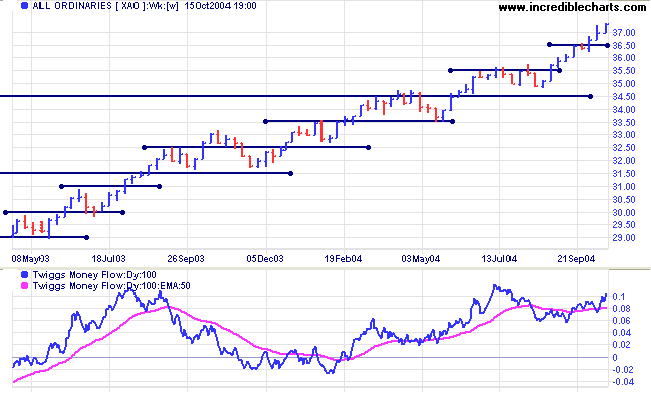
Friday's narrow trading range on the All Ordinaries, combined with exceptional volume, forms what I call a compressed spring. On an equivolume chart the pattern is referred to as an over-square day, confirming that we have committed buyers and committed sellers. This pattern often precedes a strong move. Direction of the move is determined by whichever side has greater depth and exhausts the other side first. The close at Friday's high indicates that buyers may be gaining the upper hand. A break above Thursday's high, or below Thursday's low, will give a further indication.
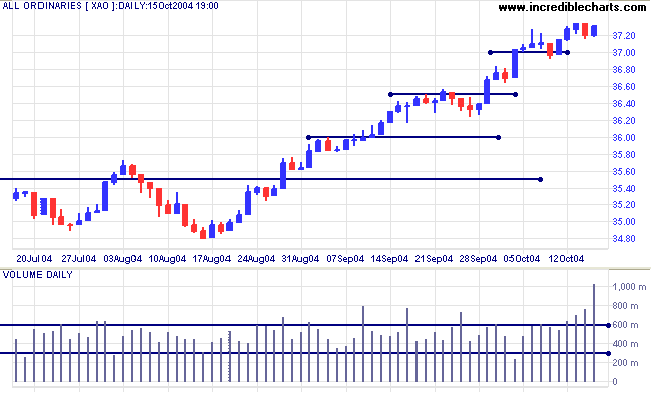
The All Ords is in a strong primary up-trend. We should, however, allow for a test of support at 3550 in the medium-term; and 3450 in the longer-term.
Many readers appear to be unaware of how to use the legend in Incredible Charts. There are basically 4 functions:
Display the Legend
The
Legend button on the toolbar or View menu displays the chart legend.
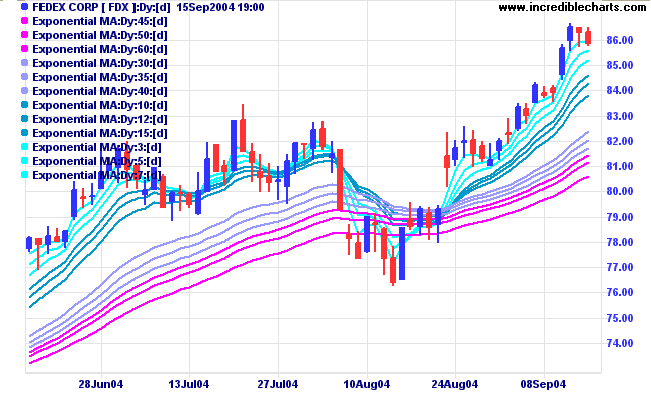
- Select Format Charts >>

Abbreviate Legend.
Amend Indicator Colors
Use the Legend function to amend the indicator colors on a chart:
- Open the

Legend - Click the color block in front of an indicator
- Select a new color and click OK.
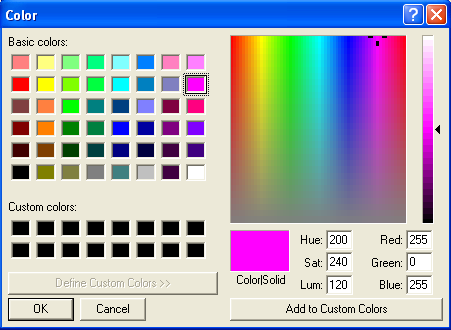
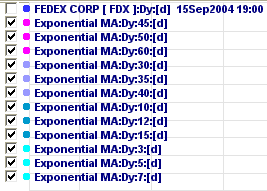
Use the Legend function to temporarily hide an indicator or price bars:
- Open the

Legend - Clear the check box in front of an indicator; or
- To hide price bars, clear the box in front of the Security name (e.g. Fedex Corp below).
Right-click on the legend button
and clear the check box in front of Show Equity Name.

The latest test version 4.0.3.720 is available for download from the website.
This features a new option at View >> Advanced Options >> Securities Menus Sorted By Sector, where users can elect to display securities menus in alphabetical (default) or sector format.
The version also offers more options under View >> Advanced Options >> Set Menu Length.
~ Andrea (17)
Back Issues

Author: Colin Twiggs is a former investment banker with almost 40 years of experience in financial markets. He co-founded Incredible Charts and writes the popular Trading Diary and Patient Investor newsletters.
Using a top-down approach, Colin identifies key macro trends in the global economy before evaluating selected opportunities using a combination of fundamental and technical analysis.
Focusing on interest rates and financial market liquidity as primary drivers of the economic cycle, he warned of the 2008/2009 and 2020 bear markets well ahead of actual events.
He founded PVT Capital (AFSL No. 546090) in May 2023, which offers investment strategy and advice to wholesale clients.
