|
Incredible Charts version
4.0.3.700
There is a new version of Incredible Charts on the server. Please check under Help >> About whether you have received the update. If you experience any difficulties with the update, please visit the new Help: Live Updates page or simply do a manual update. |
Trading Diary
October 9, 2004
These extracts from my daily trading diary are
for educational purposes and should not be interpreted as
investment advice. Full terms and conditions can be found at
Terms
of Use.
USA
The Dow Industrial Average encountered resistance at 10200, with a weak close on Monday. Strong downward bars on Thursday and Friday precede another test of support at 10000. Penetration of this level would likely reach 9800. A successful test of support would be a long-term bull signal.
The Dow Industrial Average encountered resistance at 10200, with a weak close on Monday. Strong downward bars on Thursday and Friday precede another test of support at 10000. Penetration of this level would likely reach 9800. A successful test of support would be a long-term bull signal.
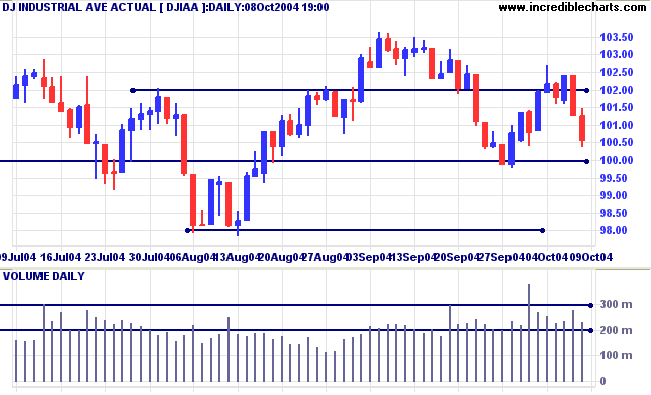
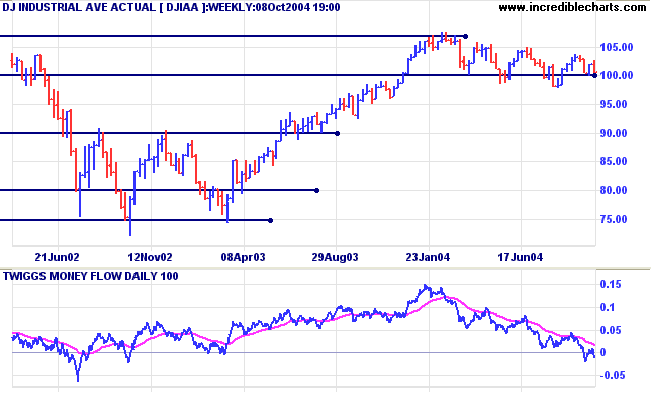
The longer-term consolidation pattern around 10000 continues to
reflect market uncertainty. An upward breakout would be signaled
by a trough above 10000, while a peak below this level would
signal a bearish breakout.
Twiggs Money Flow remains bearish, having fallen sharply since the beginning of the year.
Twiggs Money Flow remains bearish, having fallen sharply since the beginning of the year.
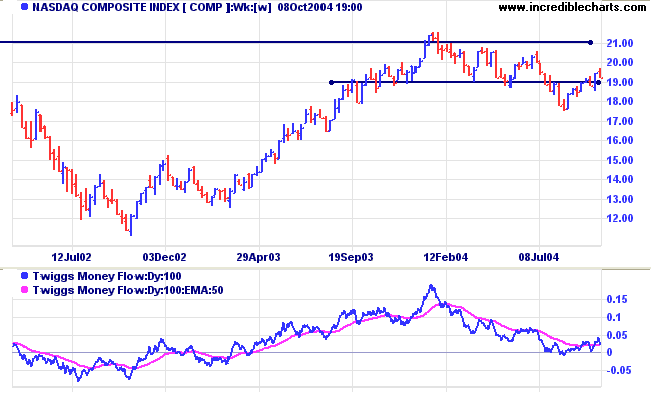
The Nasdaq Composite is about to test the new support
level at 1900. A successful test would signal a rally to test
resistance at 2100. A break back below support would likely test
the next intermediate level at 1750.
Twiggs Money Flow is whipsawing around the signal line,
reflecting indecision.
The primary trend remains downward.
The primary trend remains downward.
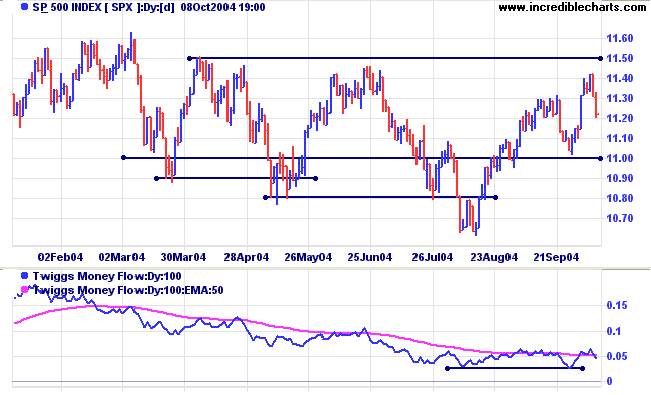
The S&P 500 encountered resistance at 1140. Strong
downward bars on Thursday and Friday signal a likely re-test of
support at 1100. Another successful test of support would be
bullish, resulting in a likely rally to 1150, and possibly a
breakout.
Twiggs Money Flow whipsaws around the signal line, reflecting indecision.
The long-term consolidation around 1100 continues. Falling troughs signal weakness but there is no clear breakout as yet.
Twiggs Money Flow whipsaws around the signal line, reflecting indecision.
The long-term consolidation around 1100 continues. Falling troughs signal weakness but there is no clear breakout as yet.
NYSE Bullish Percent
This service is no longer available.
This service is no longer available.
|
|
Treasury yields
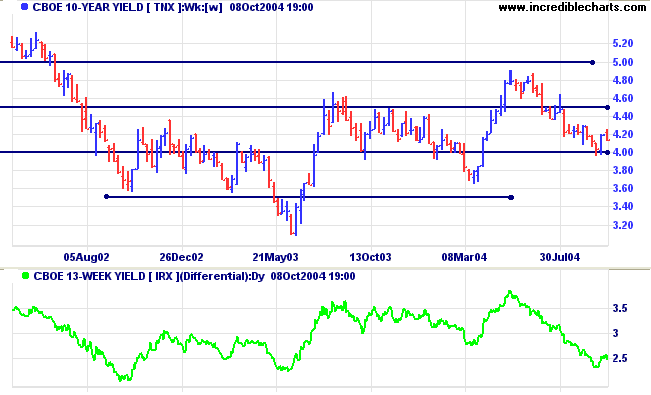
The yield on 10-year treasury notes appears headed for another test of support at 4.00%. Weaker than expected increases in non-farm payrolls support the view that the Fed will have to be cautious with further rates increases.
The yield differential (10-year T-notes minus 13-week T-bills) is at 2.5%. Differentials below 1.0% are long-term bear signals.
Gold
New York: Spot gold has rallied to close the week at $422.30.
A pull-back that respects support at $410 would be a further bull signal.
Expect resistance at the 10-year high of $427.25.
New York: Spot gold has rallied to close the week at $422.30.
A pull-back that respects support at $410 would be a further bull signal.
Expect resistance at the 10-year high of $427.25.
|
ASX Australia
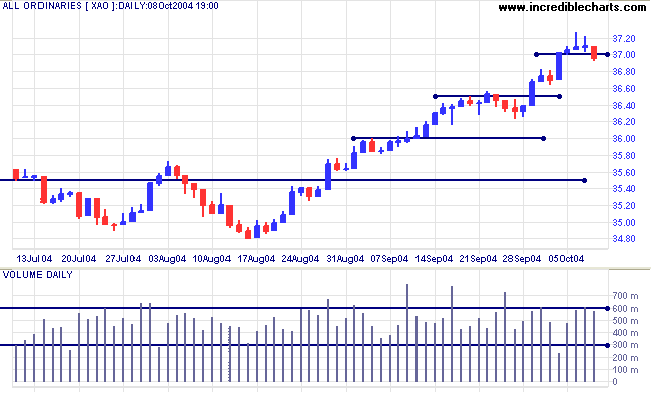
Increased volume on the All Ordinaries, accompanied by weak closes on Wednesday and Thursday, signaled profit-taking. The further that price climbs above a base, the scarcer buyers become on dips, and the more ready sellers there are at the first sign of weakness. The result is shorter rallies and longer corrections.
Friday's strong close on a red candle may herald a test of support at 3660.
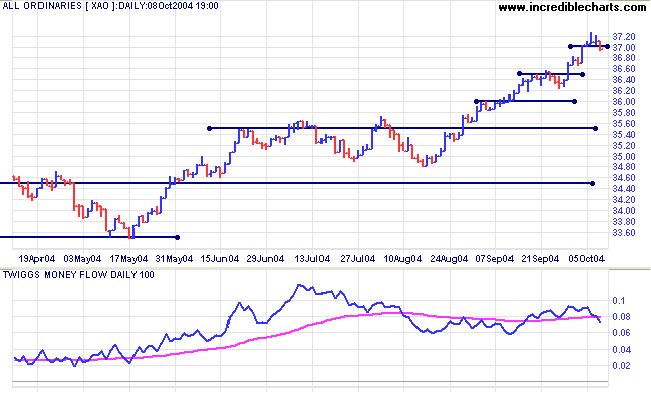
Twiggs Money Flow has crossed back below the signal line,
raising doubt over the strength of any further rally.
The All Ords is in a strong primary up-trend. However, we should allow for a test of support at 3550 in the medium-term; and 3450 in the longer-term.
The All Ords is in a strong primary up-trend. However, we should allow for a test of support at 3550 in the medium-term; and 3450 in the longer-term.
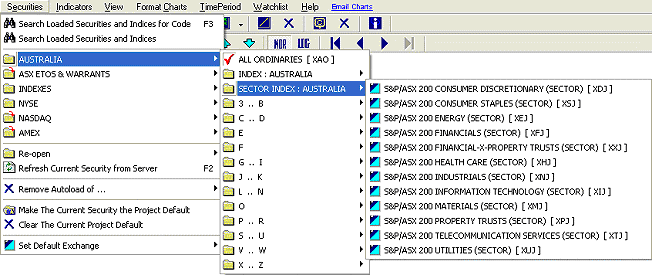
Incredible Charts - New Securities
Menu
Incredible Charts offers a new securities menu, making it easier to browse for stocks.
All menus are now ordered alphabetically, so that stocks are easier to find than on the old menus, ordered by sectors.
Australian sectors and industry groups are available on the stock screens, and can be saved as watchlists for easy scrolling.
We are still seeking a reliable source for US sector allocations.
Browsing for Securities
To browse for securities, select Securities then a loaded
exchange menu.
Unloaded menus are indicated by a
.
Sector Indices
Sectors and Indices are kept in separate folders for easy access:
Incredible Charts offers a new securities menu, making it easier to browse for stocks.
All menus are now ordered alphabetically, so that stocks are easier to find than on the old menus, ordered by sectors.
Australian sectors and industry groups are available on the stock screens, and can be saved as watchlists for easy scrolling.
We are still seeking a reliable source for US sector allocations.
Browsing for Securities
To browse for securities, select Securities then a loaded
exchange menu.
Unloaded menus are indicated by a
.
We recommend that you only upload menus that you browse
frequently. They are not needed for the new securities toolbar,
search function or stock screens; and updating slows the
opening of Incredible Charts.
Sector Indices
Sectors and Indices are kept in separate folders for easy access:
- US indices are in the Indexes menu
- Australian indices are on the Australia menu
About
the Trading Diary has been expanded to offer further
assistance to readers.
Colin Twiggs
Thank you for the feedback regarding last week's
quote.
The original source appears to be Russell Sage, a wealthy US investor from the early 20th century.
The first rule is, to keep an untroubled spirit;
for all things must bow to Nature's law,
and soon enough you must vanish into nothingness.
The second is to look things in the face and know them for what they are,
remembering that it is your duty to be a good man.
Do without flinching what man's nature demands;
say what seems to you most just - though with courtesy, modesty, and sincerity.
~ Marcus Aurelius
Back Issues
Access the Trading Diary Archives.

Author: Colin Twiggs is a former investment banker with almost 40 years of experience in financial markets. He co-founded Incredible Charts and writes the popular Trading Diary and Patient Investor newsletters.
Using a top-down approach, Colin identifies key macro trends in the global economy before evaluating selected opportunities using a combination of fundamental and technical analysis.
Focusing on interest rates and financial market liquidity as primary drivers of the economic cycle, he warned of the 2008/2009 and 2020 bear markets well ahead of actual events.
He founded PVT Capital (AFSL No. 546090) in May 2023, which offers investment strategy and advice to wholesale clients.