|
Incredible Charts version
4.0.3.700
There is a new version of Incredible Charts on the server. Please check under Help >> About whether you have received the update. If you experience any difficulties with the update, please visit the new Help: Live Updates page or simply download and install the new version to replace the old one. |
Trading Diary
September 25, 2004
The Dow Industrial Average fell sharply during the week, on moderate volume. Friday's weak close shows a brief period of consolidation before a re-test of the 10000 support level; a bearish sign.
Twiggs Money Flow is falling sharply, signaling distribution.
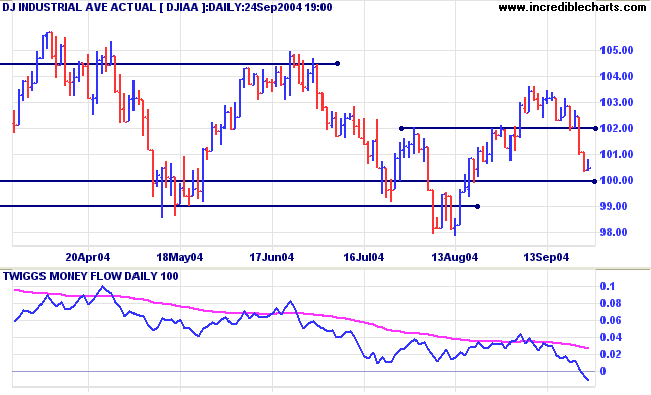
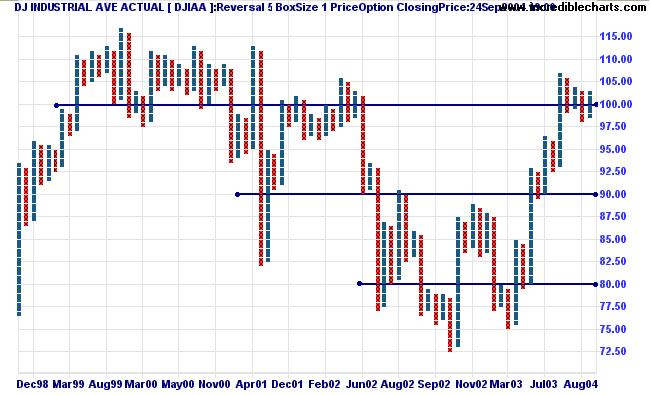
Twiggs Money Flow reflects indecision, having reversed back below the signal line.
The primary trend is still downward
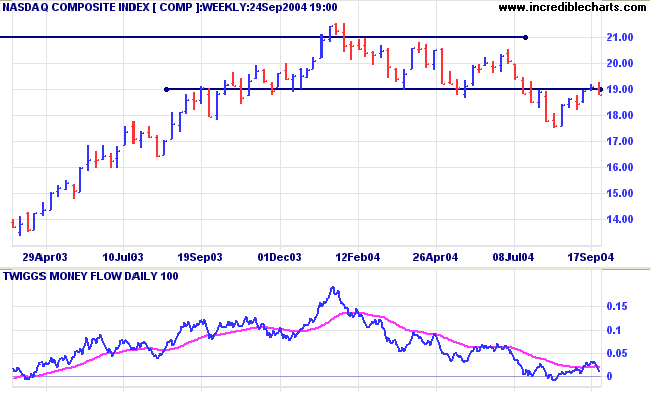
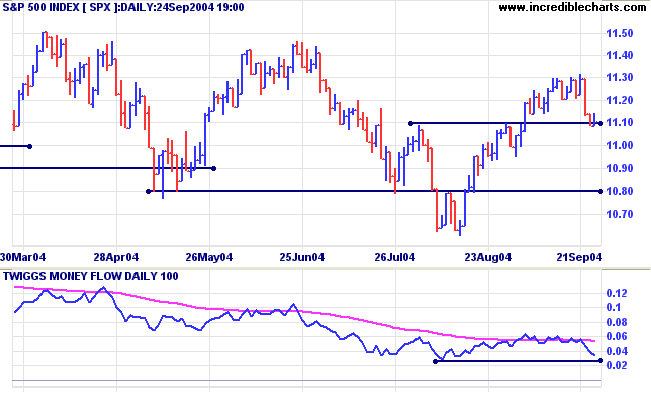
The longer term consolidation pattern continues. An intermediate trough above 1100 would be a bullish sign, while a peak below 1100 would be bearish.
|
|
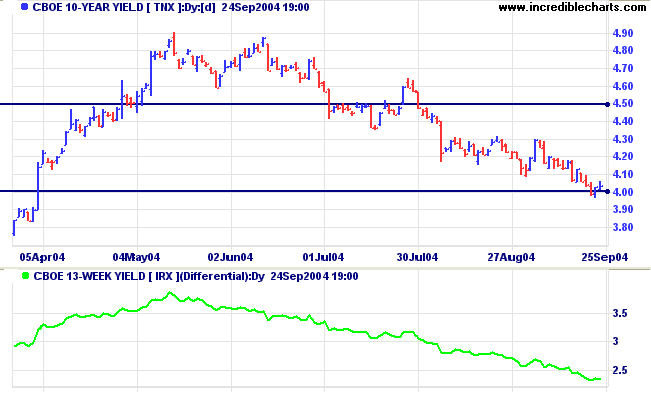
The yield on 10-year treasury notes is testing support at 4.00%, briefly dipping below the level before recovering. Market consensus (after the Fed increased rates by 0.25% on Tuesday) appears to be that future rates increases will be gradual.
The yield differential (10-year T-notes minus 13-week T-bills) eased to 2.4%.
Differentials below 1.0% are long-term bear signals.
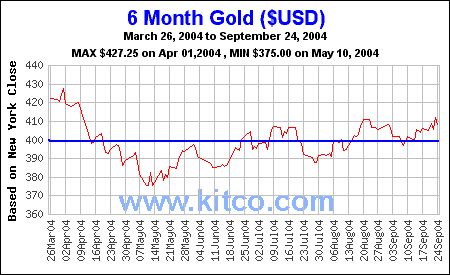
New York: Spot gold eased slightly to $407.60.
Price is consolidating above support at $400, establishing a base for further gains.
|
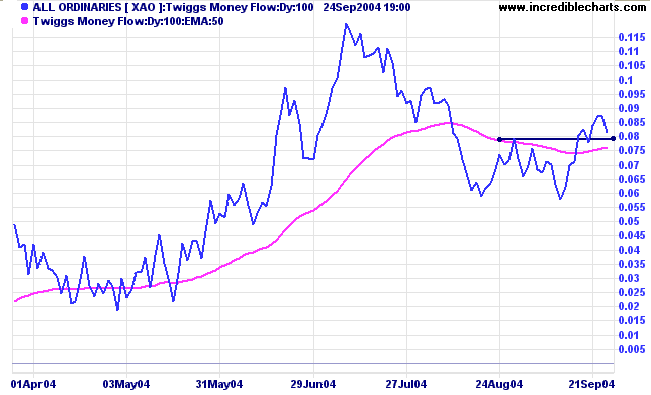
The All Ordinaries has encountered profit-taking towards the end of the week. Strong volume and a close near the low indicate that sellers are in control. The correction may test the first level of support at 3600.
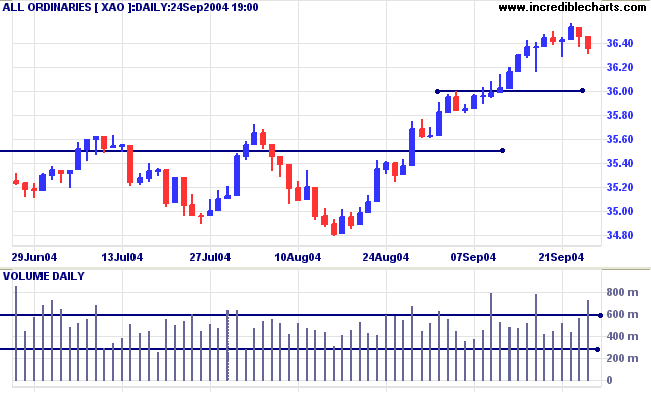
However, in the longer term, expect a re-test of support at 3450.
Incredible Charts version 4.0.3.700 incorporates a new securities toolbar, enabling you to chart securities without loading a securities exchange.

- Enter the security symbol

|
Handy Hint
If you edit codes within the text box, do not drag your mouse pointer back onto the chart while editing, keep it in the text box. Otherwise you will reactivate the normal keyboard shortcut keys (e.g. F opens the File Menu). |
- Click the Load Security button

or hit the Enter key.
|
Use the following format to enter a
security: SYMBOL_EXCHANGECODE (e.g. bhp_ax = BHP Billiton Limited, Australia ) Where EXCHANGECODE is as follows:
|
- You can also use the drop-down list to select recently loaded securities.
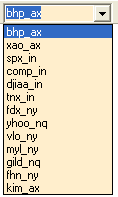
If you set a default exchange, you will not need to enter EXCHANGECODEs for securities from that exchange.
For example, if Australia is set as the Default Exchange, type bhp for BHP Billiton Limited, instead of bhp_ax.
To set a default exchange: right-click the

button and select an exchange;
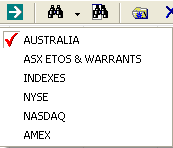
But make allowance for their doubting too,
If you can wait and not be tired by waiting,
Or being lied about, don't deal in lies,
Or being hated, don't give way to hating,
And yet don't look too good, nor talk too wise:
Rudyard Kipling: IF
Back Issues

Author: Colin Twiggs is a former investment banker with almost 40 years of experience in financial markets. He co-founded Incredible Charts and writes the popular Trading Diary and Patient Investor newsletters.
Using a top-down approach, Colin identifies key macro trends in the global economy before evaluating selected opportunities using a combination of fundamental and technical analysis.
Focusing on interest rates and financial market liquidity as primary drivers of the economic cycle, he warned of the 2008/2009 and 2020 bear markets well ahead of actual events.
He founded PVT Capital (AFSL No. 546090) in May 2023, which offers investment strategy and advice to wholesale clients.
