Products
Pricing
Education
Indicators
MyProfile
Support
Please enable Javascript to use our menu!
Alternatively navigate using
sitemap
.
sitesearch
Trading Diary
Trading Diary
Colin Twiggs
My Strategy
Disclaimer
Incredible Charts
About Us
Incredible Offer
7 Good Reasons
Free Download
What's New
Contact Us
Terms of Use
Terms of Use
Market Data Suppliers Terms
Privacy Policy
Refund Policy
Trading Diary
September 18, 2004
These extracts from my daily trading diary are for educational purposes and should not be interpreted as investment advice. Full terms and conditions can be found at
Terms of Use
.
USA
The
Dow Industrial Average
appears to be consolidating above support at 10200, a bullish sign in the medium term. Friday's weak close on high volume signals short-term weakness.
The longer-term consolidation pattern around 10000 reflects market uncertainty. A trough above 10000 would be a bullish sign, while a peak below this level would be bearish.
Twiggs Money Flow
continues to signal weakness.
The
Nasdaq Composite
broke through resistance at 1900 and is consolidating in a narrow range above the new support level. This is a bullish sign in the medium term: expect a test of resistance at 2050.
Twiggs Money Flow
signals accumulation.
The primary trend is still downward
The
S&P 500
appears headed for a test of resistance at 1150. Volume is improving, reflected in stronger readings from
Twiggs Money Flow
.
The longer term consolidation pattern continues. A trough above 1100 would be a bullish sign, while a peak below 1100 would be bearish.
NYSE Bullish Percent
The
NYSE Bullish Percent Index
rallied to 61.94%, commencing a bear correction.
Treasury yields
The yield on 10-year treasury notes is testing support at 4.00%, revealing market expectations that the Fed will have to go easy on future rate hikes.
The
yield differential
(10-year T-notes minus 13-week T-bills) eased to 2.5%.
Low differentials (below 1.0%) are generally bear signals.
Gold
New York: Spot gold has rallied to
$405.30
.
Price appears to be consolidating above support at $400, which would establish a base for further gains.
Incredible Charts - now with US Data
AMEX, NASDAQ and NYSE data
OTC BB and Pink Sheet stocks
more than 500 market and sector indices
FREE trial -
Click Here
ASX Australia
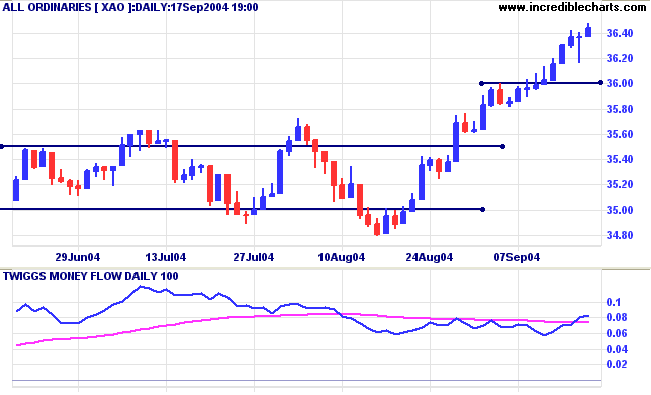
Thursday's reaction on the
All Ordinaries
was met with strong buying which quickly overcame selling pressure. The short reaction indicates trend strength in the short to medium term.
Twiggs Money Flow
has recovered to complete a double bottom, signaling accumulation.
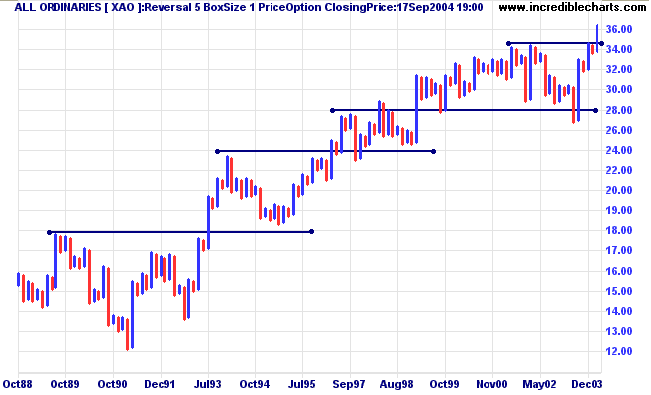
The point and figure chart below highlights major trend movements over the last 16 years (select a reversal amount of 5 to highlight long-term price movements).
In the longer term, expect a re-test of support at 3450.
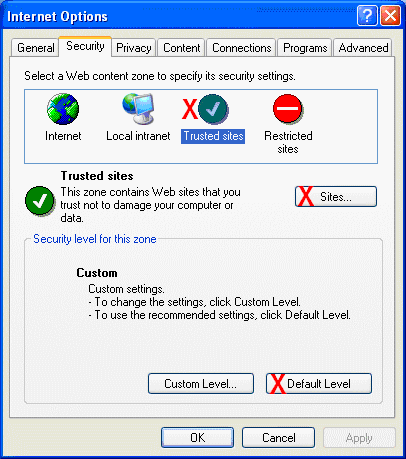
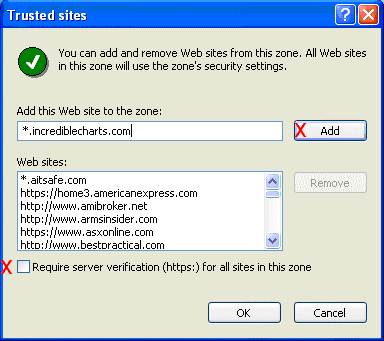
Internet Explorer Setup
Please test your Internet Explorer settings and configure your Trusted Sites if necessary:
If your Trusted sites are set correctly, the icon
will display in the bottom right corner of the following pages:
http://www.incrediblecharts.com
http://app.incrediblecharts.com
https://app.incrediblecharts.com
Configure your Trusted Sites
Open Internet Explorer and go to
Tools>>Internet Options>>Security
Select
Trusted Sites
and click the
Sites
button
Enter
*.incrediblecharts.com
Clear the check box:
Require server verification (https) for all sites in this zone
Click the
Add
button
Click
OK
to return to the Security tab
Click the
Default Level
button (for Trusted Sites)
Click
OK
.
About the Trading Diary
has been expanded to offer further assistance to readers.
Colin Twiggs
Because of our own deep-seated negative concepts about life,
we have automatically and unconsciously imagined lack, limitation,
difficulties and problems to be our lot in life.
To one degree or another that is what we have created for ourselves.
~ Shakti Gawain : Creative Visualization
Back Issues
Click here to access the
Trading Diary Archives
.
Back Issues
Access the Trading Diary Archives.
Email
Print Friendly
Increase Font
Decrease Font
Most Popular Links
Colin Twiggs' Trading Diary
Free Download
Connection Test
My Strategy
Twiggs Money Flow
How to Trade MACD Divergences
Time your Exits with ATR Trailing Stops
2 Great Bollinger Band Trading Strategies
Moving Averages
Candlestick Chart Patterns
Top of Page