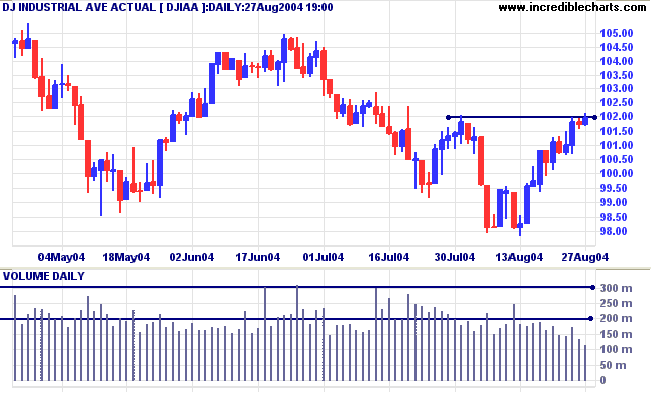
The Dow Industrial Average is testing resistance at 10200, within the consolidation pattern that started early 2004. Low volume on the rally signals a lack of commitment from buyers.
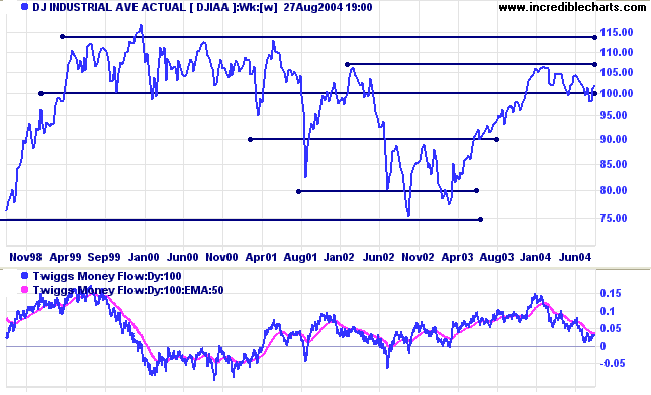
Twiggs Money Flow has formed a double bottom but does not yet signal accumulation.
Select Securities >> Refresh Current Security From Server or fast key F2 to refresh this.
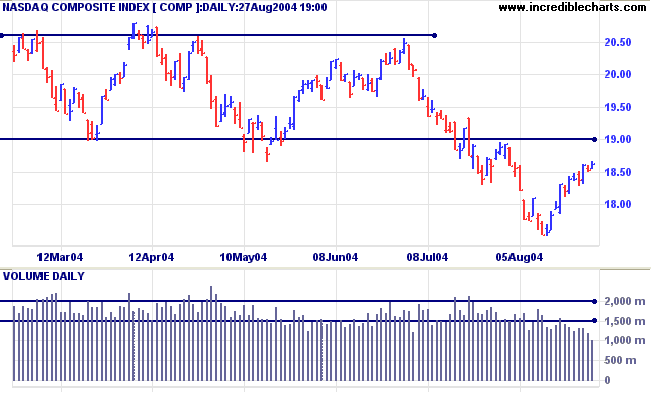
The primary trend is headed downward. The latest rally is on low volume and appears unlikely to break resistance at 1900.
Twiggs Money Flow (not shown) continues to signal distribution.
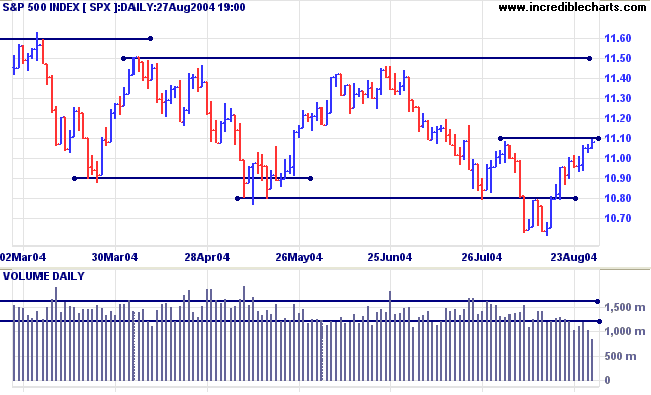
Twiggs Money Flow (not shown) continues to signal distribution.
|
|
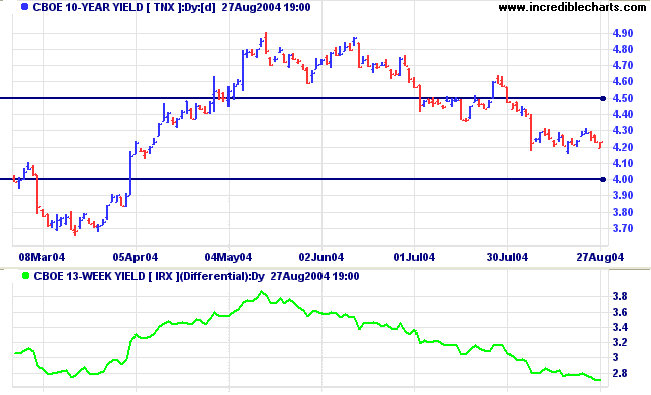
The yield on 10-year treasury notes is consolidating in a narrow range above 4.20%; normally a continuation sign in a down-trend.
Expect a re-test of support at 4.00%.
The yield differential (10-year T-notes minus 13-week T-bills) is declining but still healthy at 2.7%.
Low differentials, of below 1.0%, are strong bear signals.
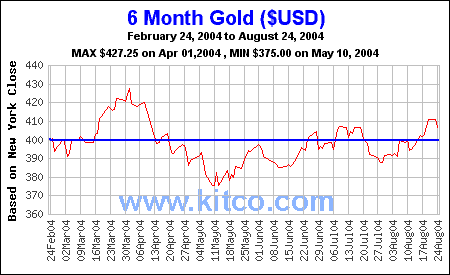
New York: Spot gold fell to $402.90. Marginal new highs indicate a lack of commitment from buyers.
|
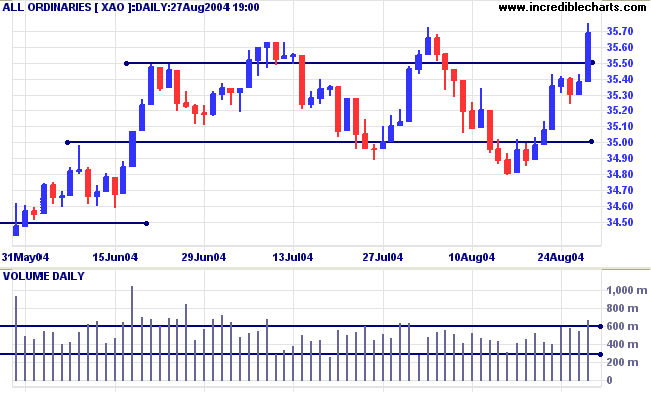
The All Ordinaries rallied strongly above 3550, on increased volume. The next signal to look out for is a pull-back that respects support at 3550.
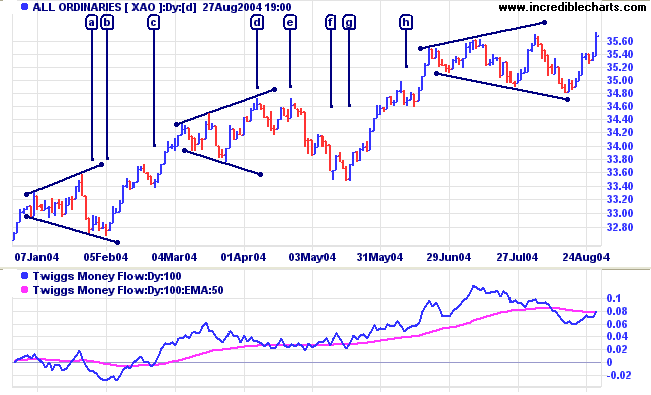
Note also the consolidations at [c] and [h], accompanied by a bullish pull-back on Twiggs Money Flow, which failed to cross below the signal line. A similar pull-back that holds above 3550 would be a bullish sign.
Most readers should by now have received the Windows XP update to Service Pack 2.
This includes the new Windows Firewall. If you have not received the update:
-
Go to Start >> Control
Panel >> System
-
Select the Automatic
Updates tab
-
Select Automatic and
click OK.
-
Then go to Start >> All
Programs >> Windows Update
- Select Express Install and click the Install button
Adding Incredible Charts to the new Windows Firewall
-
From your Start button,
select Control Panel >> Windows
Firewall
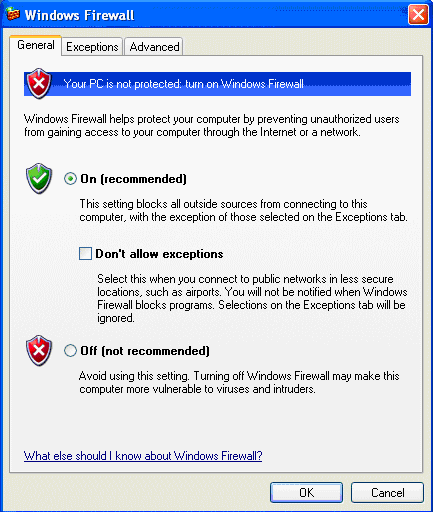
- On the General tab, select On
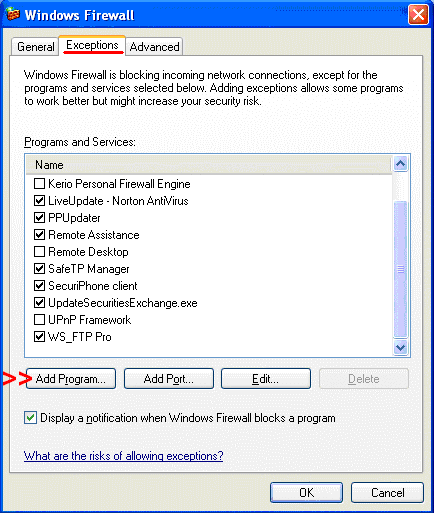
- Select the Exceptions tab
-
If IncredibleCharts Pro is not listed
- Select the Add Program button
- Select IncredibleCharts Pro from the Program List
-
Click OK
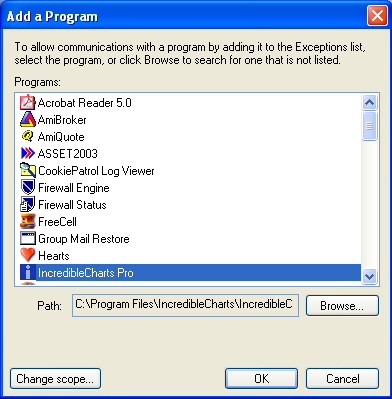
If necessary, use the Browse button to locate the program.
The normal location is C:\Program Files\Incredible Charts\IncredibleCharts.exe
-
On the Exceptions list,
check the box alongside IncredibleCharts Pro
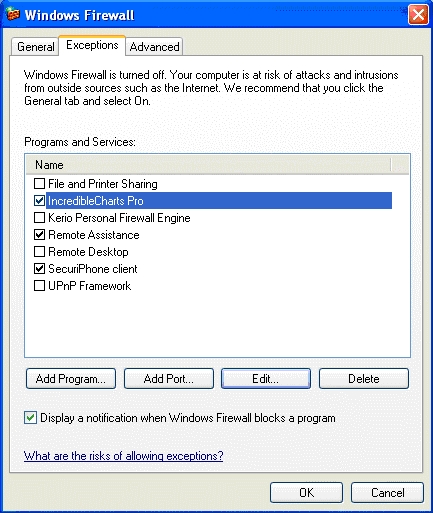
- Click OK
The update also replaces Internet Explorer and Outlook Express.
You may need to reset your email browser to accept images:
- Open Outlook Express
- Select Tools >> Options
- Go to the Security tab
- Ensure that the box under Download Images is not checked
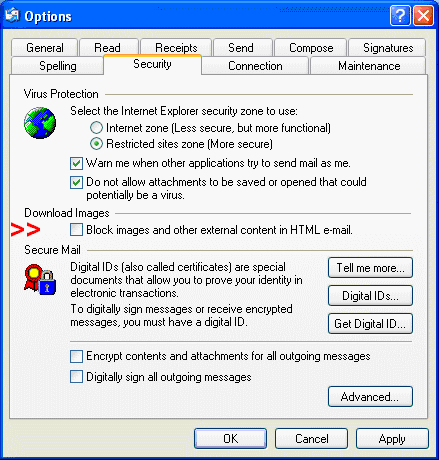
- Click OK
~ Oscar Wilde
Click here to access the Trading Diary Archives.
Back Issues

Author: Colin Twiggs is a former investment banker with almost 40 years of experience in financial markets. He co-founded Incredible Charts and writes the popular Trading Diary and Patient Investor newsletters.
Using a top-down approach, Colin identifies key macro trends in the global economy before evaluating selected opportunities using a combination of fundamental and technical analysis.
Focusing on interest rates and financial market liquidity as primary drivers of the economic cycle, he warned of the 2008/2009 and 2020 bear markets well ahead of actual events.
He founded PVT Capital (AFSL No. 546090) in May 2023, which offers investment strategy and advice to wholesale clients.
