|
Incredible Charts 4.0.3.400 is now
available!
Your version of Incredible Charts should automatically update to the new version. Check under Help >> About on the charts menu to establish whether you have the latest version. If not, download and install over your existing version. See What's New! (below) for a list of new features. |
USA
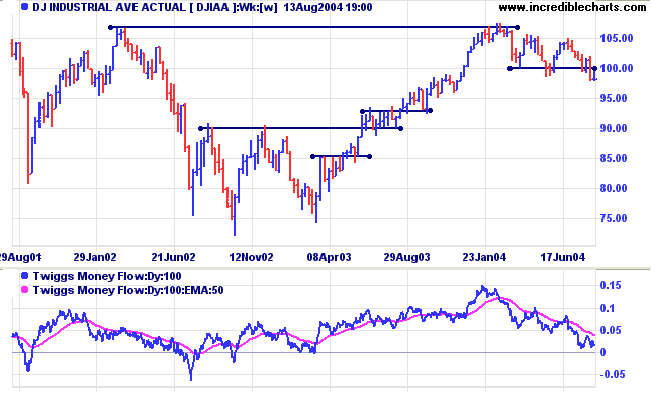
The Dow Industrial Average pull-back respected resistance at 10000. Light volume on the up-swing and stronger volume on the decline warn of further weakness.
The Dow Industrial Average pull-back respected resistance at 10000. Light volume on the up-swing and stronger volume on the decline warn of further weakness.
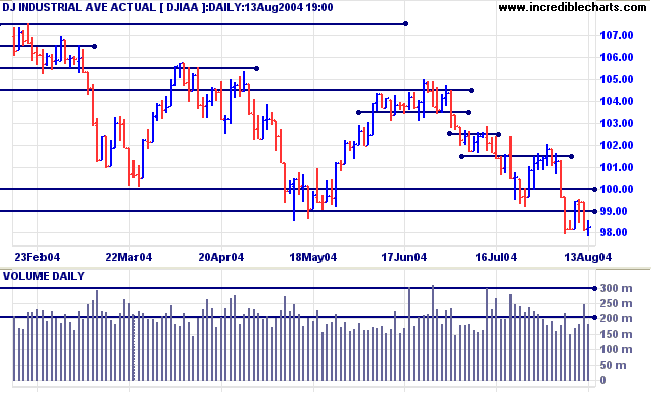
The primary trend has reversed; following the NASDAQ into a
down-trend.
In the next few weeks, there could still be a stronger (intermediate) pull-back to re-test resistance at 10000.
Twiggs Money Flow signals strong distribution.
In the next few weeks, there could still be a stronger (intermediate) pull-back to re-test resistance at 10000.
Twiggs Money Flow signals strong distribution.
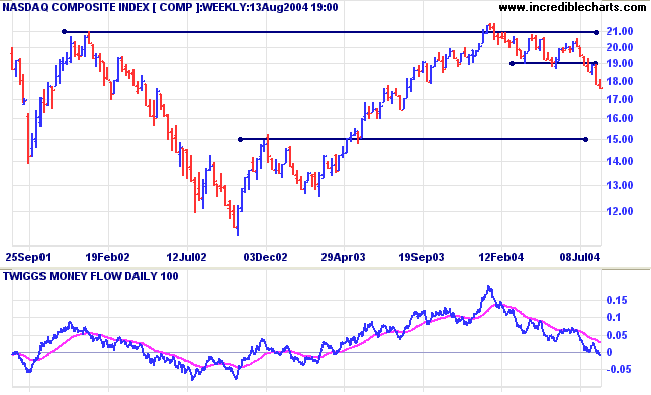
The Nasdaq Composite primary trend continues
downward.
Twiggs Money Flow signals strong distribution.
Twiggs Money Flow signals strong distribution.
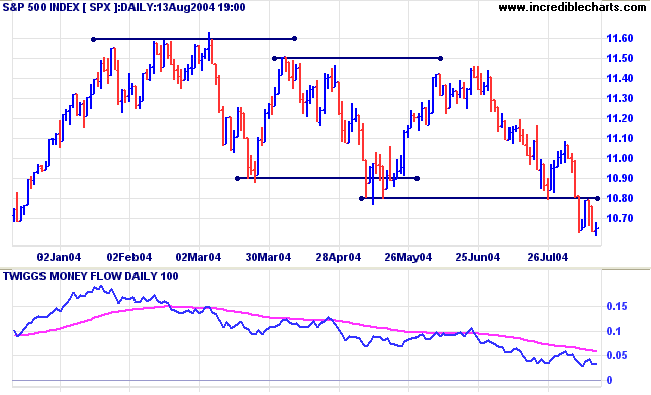
The S&P 500 pulled back on light volume and failed to
break the first level of resistance at 1080. The primary trend
has turned downward.
We could still later see a stronger (intermediate pull-back re-test resistance at 1080/1100.
Twiggs Money Flow signals strong distribution, with continued peaks below the signal line.
We could still later see a stronger (intermediate pull-back re-test resistance at 1080/1100.
Twiggs Money Flow signals strong distribution, with continued peaks below the signal line.
NYSE Bullish Percent
The NYSE Bullish Percent Index has fallen to 53.47%, continuing the strong bear signal.
The NYSE Bullish Percent Index has fallen to 53.47%, continuing the strong bear signal.
|
|
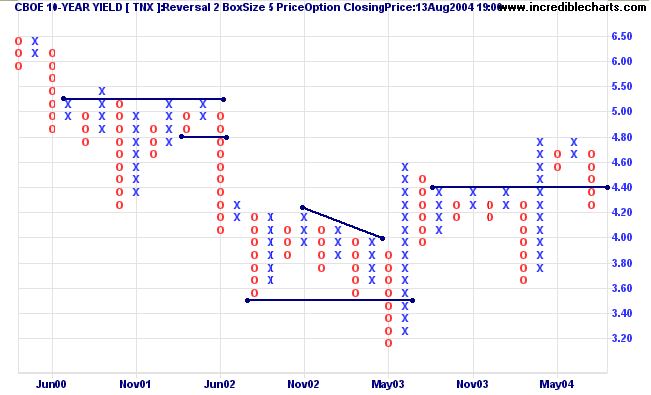
Treasury yields
The yield on 10-year treasury notes has fallen below immediate support, reflecting a flow of capital from the equities markets.
Rising energy prices and weaker economic data may force the Fed to slow down on further rates increases.
Expect a re-test of support at 3.50% (or 3.60%).
The yield differential (10-year T-notes minus 13-week T-bills) is just below 3.0% - still healthy.
Low differentials, of below 1.0%, are strong bear signals.
Gold
New York: Spot gold rallied to $398.60, again testing resistance at $400 - a bullish sign.
Long-term support is at $375 and resistance at $427.25. A breakout below/above these levels will signal resumption of the primary trend.
New York: Spot gold rallied to $398.60, again testing resistance at $400 - a bullish sign.
Long-term support is at $375 and resistance at $427.25. A breakout below/above these levels will signal resumption of the primary trend.
|
ASX Australia
The All Ordinaries displayed reasonable buying support from [m] to [w] but this faded. Sellers were firmly in control by Friday [f] with a break below support at 3500. US sentiment appears to be weighing down the local market.
The All Ordinaries displayed reasonable buying support from [m] to [w] but this faded. Sellers were firmly in control by Friday [f] with a break below support at 3500. US sentiment appears to be weighing down the local market.
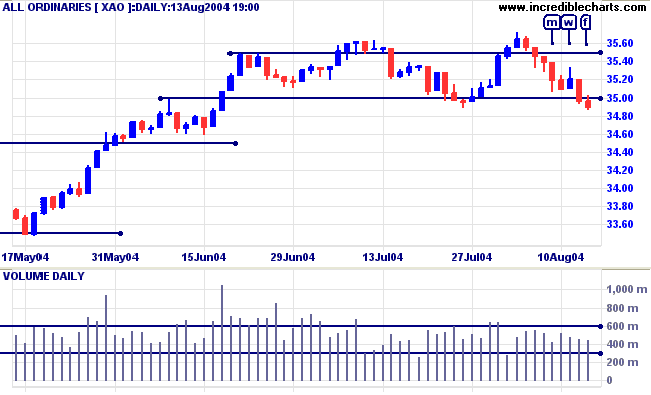
The fall below 3500 is likely to test support
at 3450. If that level holds, it would be a long-term bull
signal.
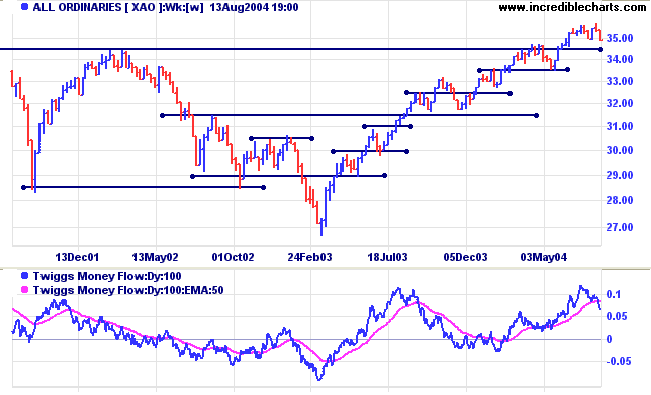
If the level fails to hold and the index falls below 3350, this will signal reversal of the primary trend.
Twiggs Money Flow has dropped sharply, signaling that sellers are in control.
If the level fails to hold and the index falls below 3350, this will signal reversal of the primary trend.
Twiggs Money Flow has dropped sharply, signaling that sellers are in control.
Incredible Charts 4.0.3.400 - What's
New!
This is the last revision before the promised Stock Screen upgrade. Changes are largely to improve ease of use, but there is a significant improvement to Equivolume charts.
Equivolume Charts - Now with Candlesticks
Equivolume charts now default to Candlevolume format.
This means that Open, High, Low and Close are displayed on the chart in the same format as regular candlesticks. The only difference is that the width of the bar depicts volume, and shadows are depicted by a lighter color shade. Take a look at the AMD chart below:
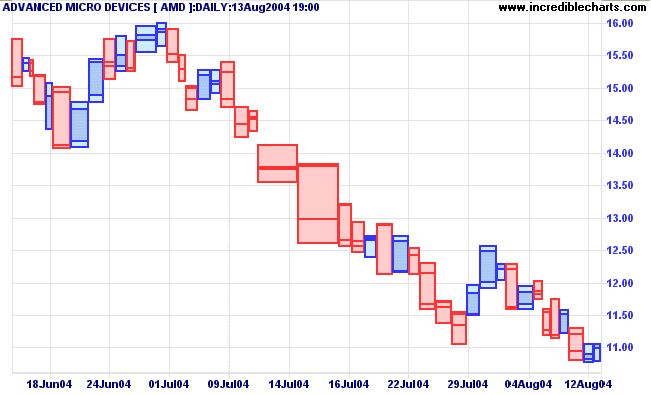
Bar colors are:
- Blue if the Close is Higher than the Open (or green depending on your color scheme);
- Red if the Open is higher than the Close; and
- The same color as the previous bar if the Open and Close are equal.
New Toolbar Speed-Keys
- Right-click on the DOWN toolbar arrow

pops up the Active Watchlist menu
- Right-click on the UP toolbar arrow

pops up the Watchlist menu
- Right-click on the trendlines icon

enables you to Hide/Display all Trendlines
- Right-click on the captions icon

enables you to Hide/Display all Captions
- Right-click on the left and right scroll arrows

pops up the Set Scroll Period menu.
- Right-click on the legend

hides the security name.
New Project Tabs
-
Recently used files are now displayed as
tabs at the bottom of the chart, just above the price
bar.
Click on a tab, for example [Relative Strength], to display the project file.
Right-click on the tabs to remove them, or select Hide Project Tabs under View >> Advanced Options.
Other Convenient Features
Back Issues
-
The Advanced Options menu
has been moved to the View
menu.
New commands are Hide Project Tabs and Display Equivolume HLC.
-
Point & Figure menus are now
ordered by Price method, Box size and Reversal
amount, if you use multiple settings.
-
The Securities >>
Re-open command now remembers securities from previous
sessions.
-
The charting application tests HTTP and
HTTPS connections on start-up.
-
Firewall troubleshooting has been improved,
if users experience connection difficulties.
- Caption boxes - when the dialog box is open, the up-down arrows no longer cause the chart to scroll.
About
the Trading Diary has been expanded to offer further
assistance to readers, including directions on how to search
the archives.
Colin Twiggs
A basic need of all human beings is to make a positive
contribution to the world and to our fellow beings,
as well as to improve and enjoy our personal lives.
We all have a great deal to offer the world and each other,
each in our own special and unique way.
To a great degree, our own personal sense of well being
is a function of how much we are expressing this..
~ Shakti Gawain: Creative Visualization
Back Issues
Click here to access the Trading Diary Archives.
Click here to access the Trading Diary Archives.
Back Issues
Access the Trading Diary Archives.

Author: Colin Twiggs is a former investment banker with almost 40 years of experience in financial markets. He co-founded Incredible Charts and writes the popular Trading Diary and Patient Investor newsletters.
Using a top-down approach, Colin identifies key macro trends in the global economy before evaluating selected opportunities using a combination of fundamental and technical analysis.
Focusing on interest rates and financial market liquidity as primary drivers of the economic cycle, he warned of the 2008/2009 and 2020 bear markets well ahead of actual events.
He founded PVT Capital (AFSL No. 546090) in May 2023, which offers investment strategy and advice to wholesale clients.