The NYSE Bullish Percent Index has fallen to 55.41%, after a strong bear signal.
|
|
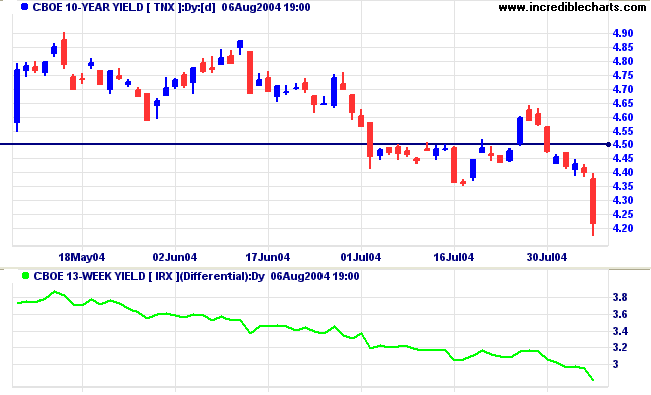
The yield on 10-year treasury notes fell through support at 4.35%, reflecting a more pessimistic outlook for the economy.
Expect a re-test of support at 3.50%.
The yield differential (10-year T-notes minus 13-week T-bills) has declined below 3.0%.
Low differentials, of below 1.0%, are strong bear signals.
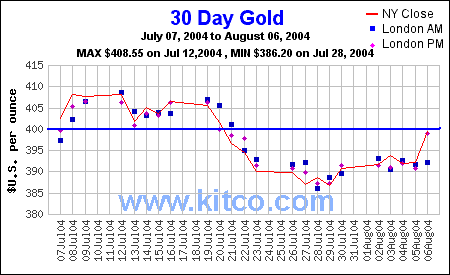
New York: Spot gold jumped to $399.30 just before the close, reacting to a tough day in the equity markets.
Initial resistance is at $400 to $408.
Long-term support is at $375 and resistance at $427.25. A breakout below/above these levels will signal resumption of the primary trend.
|
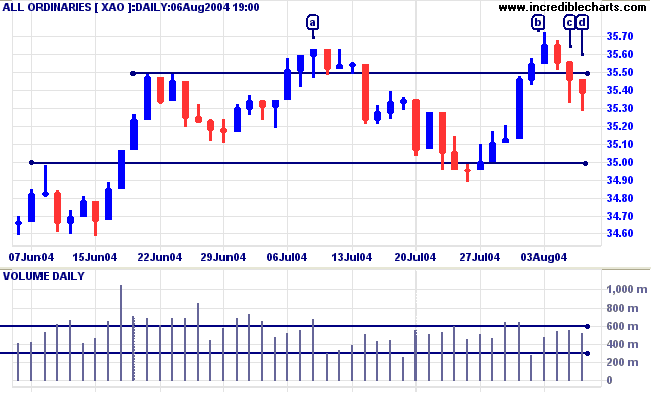
The All Ordinaries made two marginal breaks above resistance of 3550, at [a] and [b], before retreating back within the consolidation pattern. Weak closes and higher volume at [c] and [d] indicate buying support.
An upward breakout would require confirmation from a pull-back that respects support at 3550.
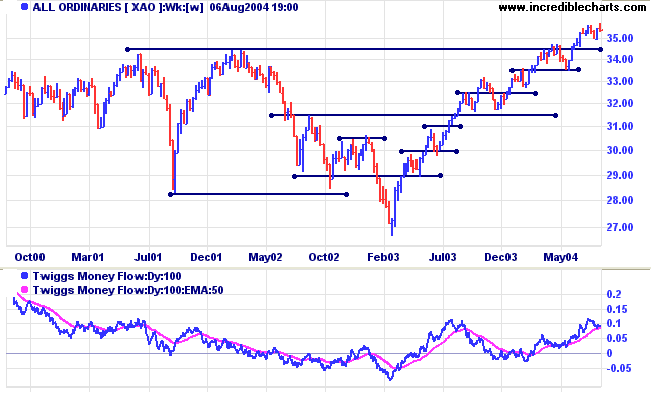
If support at 3450 does not hold and the index breaks below 3350, it will signal reversal of the primary trend.
Twiggs Money Flow signals accumulation, favoring continuation of the primary up-trend.
Retracements (or corrections) during a trend tell us about the strength of that trend. They test the strength of buyers' or sellers' commitment and establish a base for further gains (or losses). There are four major categories:
- long retracement (covered last week)
- overlapping retracement (covered last week)
- short retracements (addressed today)
- no retracement - during an upward/downward spike (covered previously).
Short Retracements
A short retracement, against the direction of the primary trend, signals trend strength.
A short movement, in the direction of the primary trend, indicates trend weakness and a possible reversal.
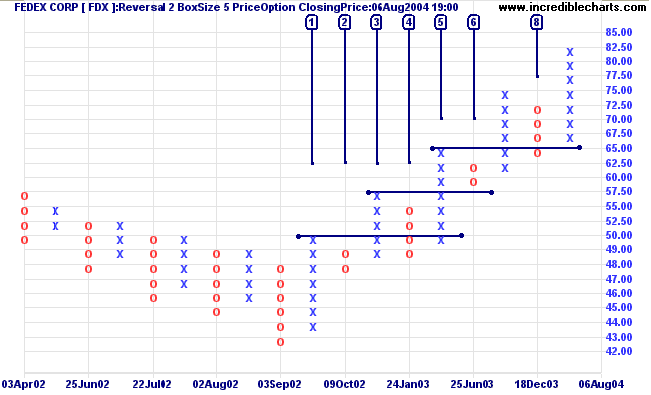
A short column of Os at [2], on the Fedex chart below, is in the direction of the down-trend. It follows a long retracement at [1] and signals reversal of the primary trend to an up-trend.
-
The first level of support encountered by
retracement [6] is the high of [3] at 57.50. If price
respects this level it signals that buyers are in control and
the trend is strong.
This often coincides with a 50% Fibonacci retracement of the previous up-swing. - The second level of support is stronger, at the low of [4]. Penetration of this level will signal trend weakness (for example, at [1] in the previous down-trend). If price falls through the first support level but respects the second, the trend is still intact. However, price is likely to advance at a sedate pace, with buyers and sellers more evenly matched.
- that is you deeply desire it,
you completely believe that you can do it,
and you are totally willing to have it
- it simply cannot fail to manifest,
and usually within a very short time.
~ Shakti Gawain: Creative Visualization
Click here to access the Trading Diary Archives.
Back Issues

Author: Colin Twiggs is a former investment banker with almost 40 years of experience in financial markets. He co-founded Incredible Charts and writes the popular Trading Diary and Patient Investor newsletters.
Using a top-down approach, Colin identifies key macro trends in the global economy before evaluating selected opportunities using a combination of fundamental and technical analysis.
Focusing on interest rates and financial market liquidity as primary drivers of the economic cycle, he warned of the 2008/2009 and 2020 bear markets well ahead of actual events.
He founded PVT Capital (AFSL No. 546090) in May 2023, which offers investment strategy and advice to wholesale clients.
