|
New Diary Format |
|
We are experimenting with a new format for
the Weekly Trading Diary in order to speed up delivery
times, improve the delivery of images (both charts and ads)
and reduce the number of bounced messages (from firewalls
and spam filters). Please report any difficulties to support. |
Trading Diary
July 24, 2004
These extracts from my daily trading diary
are for educational purposes
and should not be interpreted as investment
advice. Full terms and conditions can be found at Terms
of Use.
USA
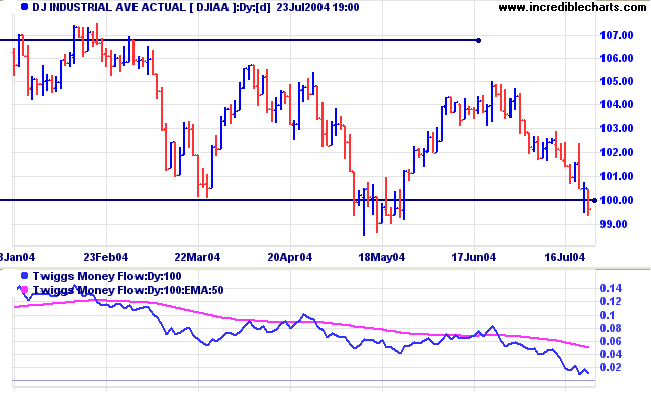
The Dow Industrial Average is testing support at 10000/9900 on reasonable volume.
The long-term consolidation pattern (over the last 7 months) can break out in either direction. An upward breakout is more likely because we are in an up-trend, but the possibility of a reversal cannot be ignored. Direction will only be clear when we have a breakout from the pattern: above 10500, or below 9900, followed by a pull-back that confirms the breakout.
Twiggs Money Flow is falling steeply, signaling distribution.
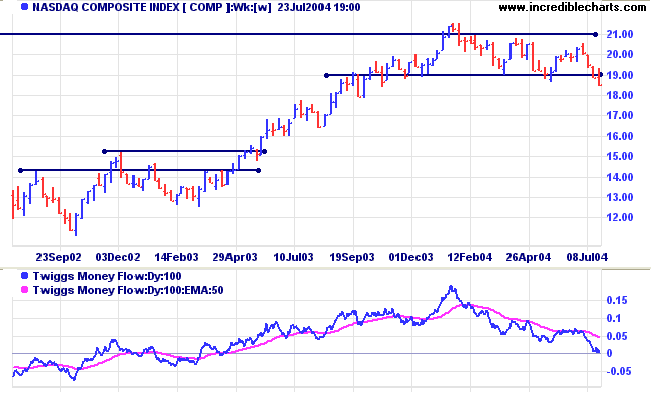
The Nasdaq Composite has broken through
support at the base of the recent consolidation pattern. A
pull-back that respects the new 1900 resistance level, would
confirm that the primary trend has reversed downward.
Recovery back above 2100 would be a strong bull signal.
Twiggs Money Flow is falling sharply, signaling distribution.
Recovery back above 2100 would be a strong bull signal.
Twiggs Money Flow is falling sharply, signaling distribution.
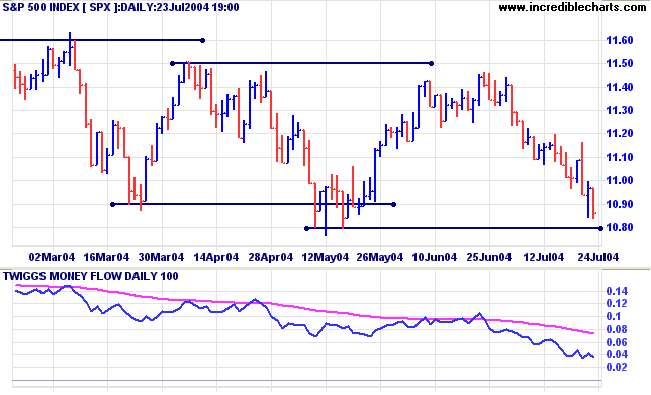
The S&P 500 is still testing support
at the base of the consolidation pattern. A downward breakout,
followed by a pull-back that respects the new resistance level
(1080/1100), would signal that the primary trend has reversed
downward.
Twiggs Money Flow signals strong distribution.
Twiggs Money Flow signals strong distribution.
NYSE Bullish Percent
The NYSE Bullish Percent Index eased to 61.77%. A fall below 60.0% would be a strong bear signal.
The NYSE Bullish Percent Index eased to 61.77%. A fall below 60.0% would be a strong bear signal.
|
|
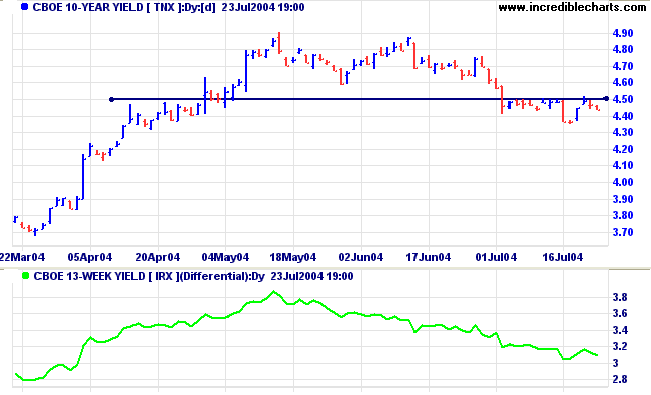
Treasury yields
The yield on 10-year treasury notes continues to consolidate in a narrow range below resistance at 4.50%, recovering from the strong downward breakout last Friday.
A break above 4.50% would be a bull signal. A downward breakout would likely test support at 3.60%.
The yield differential (10-year T-notes minus 13-week T-bills) remains healthy at 3.1%.
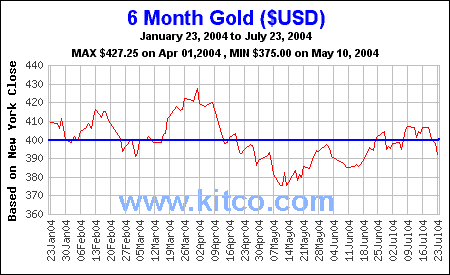
Gold
New York: The test of resistance at $427.25 failed to materialize. Spot gold has fallen sharply to $389.90, on the back of the stronger US dollar, and appears headed for a test of $375.00.
New York: The test of resistance at $427.25 failed to materialize. Spot gold has fallen sharply to $389.90, on the back of the stronger US dollar, and appears headed for a test of $375.00.
|
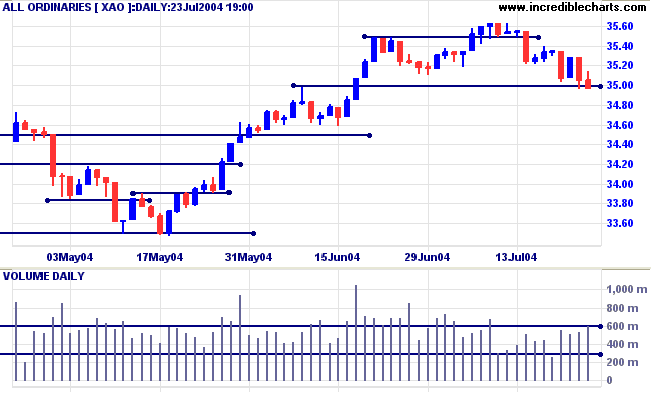
ASX Australia
The All Ordinaries is testing support at 3500. Volume has recovered over the last week, signaling increased selling pressure.
Expect either a consolidation over the next few weeks or a re-test of support levels at 3450 and 3350.
The All Ordinaries is testing support at 3500. Volume has recovered over the last week, signaling increased selling pressure.
Expect either a consolidation over the next few weeks or a re-test of support levels at 3450 and 3350.
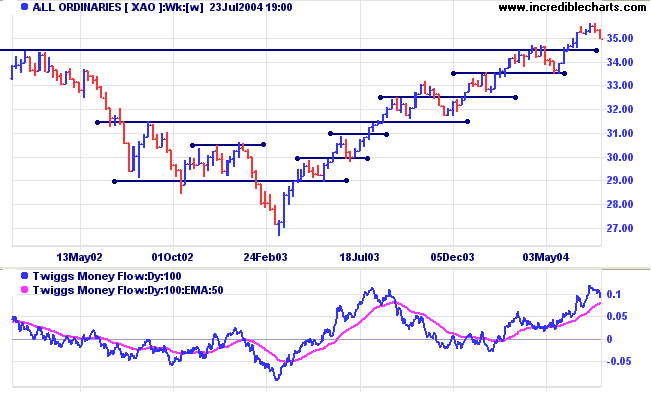
A secondary correction that respects support at
the previous high of 3450 would be a long-term bull
signal.
A fall below 3350 would be a bear signal, indicating reversal of the primary trend.
Twiggs Money Flow continues to signal accumulation.
A fall below 3350 would be a bear signal, indicating reversal of the primary trend.
Twiggs Money Flow continues to signal accumulation.
Point & Figure
Will be continued next week.
Will be continued next week.
About
the Trading Diary has been expanded to offer further
assistance to readers, including directions on how to search the
archives.
Colin Twiggs
Sometimes the best trades are not the winning
ones that put money in your pocket;
sometimes they are the ones that get you out of the market at the right time.
~ Phil Flynn
sometimes they are the ones that get you out of the market at the right time.
~ Phil Flynn
Back Issues
Click here to access the Trading Diary Archives.
Click here to access the Trading Diary Archives.
Back Issues
Access the Trading Diary Archives.

Author: Colin Twiggs is a former investment banker with almost 40 years of experience in financial markets. He co-founded Incredible Charts and writes the popular Trading Diary and Patient Investor newsletters.
Using a top-down approach, Colin identifies key macro trends in the global economy before evaluating selected opportunities using a combination of fundamental and technical analysis.
Focusing on interest rates and financial market liquidity as primary drivers of the economic cycle, he warned of the 2008/2009 and 2020 bear markets well ahead of actual events.
He founded PVT Capital (AFSL No. 546090) in May 2023, which offers investment strategy and advice to wholesale clients.