|
New Diary Format |
|
We are experimenting with a new format for
the Weekly Trading Diary in order to speed up delivery
times, improve the delivery of images (both charts and ads)
and reduce the number of bounced messages (from firewalls
and spam filters). The Weekly Diary will be published on the website at https://tradingdiary.incrediblecharts.com/trading_diary.php. It may be useful to save this address to your Favorites folder. You will receive a short email notifying you when the Diary has been published. Click on the link provided and the Diary will open in your default browser. Please report any difficulties to support. |
Trading Diary
July 10, 2004
These extracts from my daily trading diary
are for educational purposes
and should not be interpreted as investment
advice. Full terms and conditions can be found at Terms
of Use.
USA
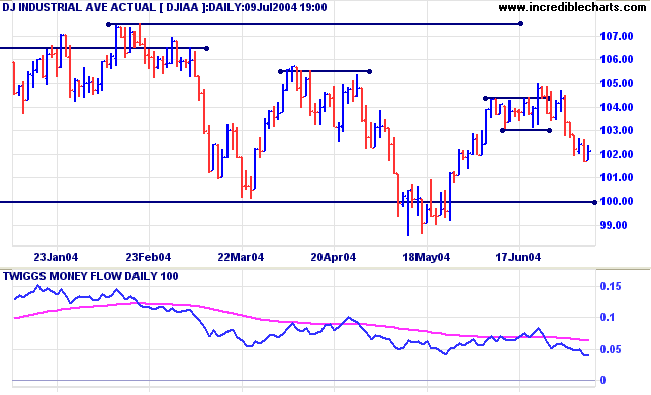
The Dow Industrial Average is drifting lower on light volume.
Expect another test of the 10000 support level. The overall pattern is one of consolidation and can break out in either direction. Obviously, in an up-trend, an upward breakout is more likely, but a possible reversal cannot be ignored. Direction will only be clear when we have a breakout from the consolidation pattern: above 10500 or below 9900 followed by a pull-back that confirms the breakout.
Twiggs Money Flow is drifting lower, signaling weak distribution.
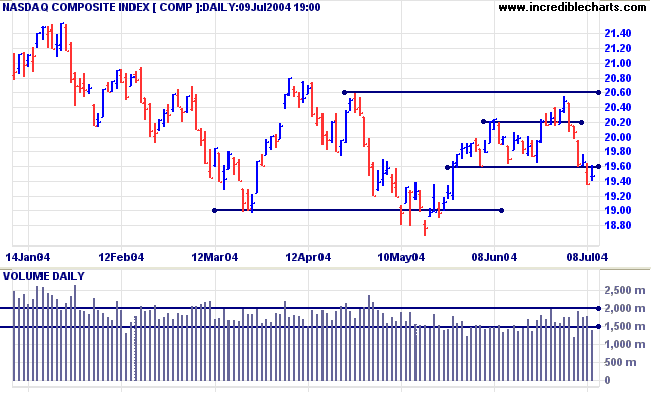
The Nasdaq Composite has broken through
support at 1960. Friday's pull back displays light volume and a
weak close, signaling further downside. Direction will only be
clear when we have a breakout from the consolidation pattern:
above 2060, or below 1865, followed by a pull-back that confirms
the breakout.
Twiggs Money Flow is drifting sideways.
Twiggs Money Flow is drifting sideways.
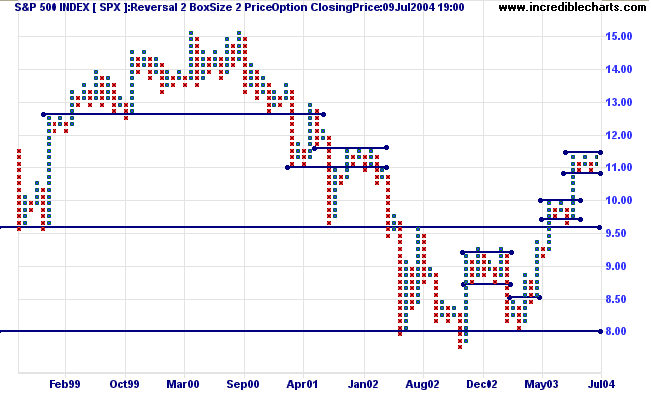
The same consolidation pattern appears on the
S&P 500. Breakouts will require confirmation before
they can be relied upon.
Twiggs Money Flow signals further distribution.
Twiggs Money Flow signals further distribution.
|
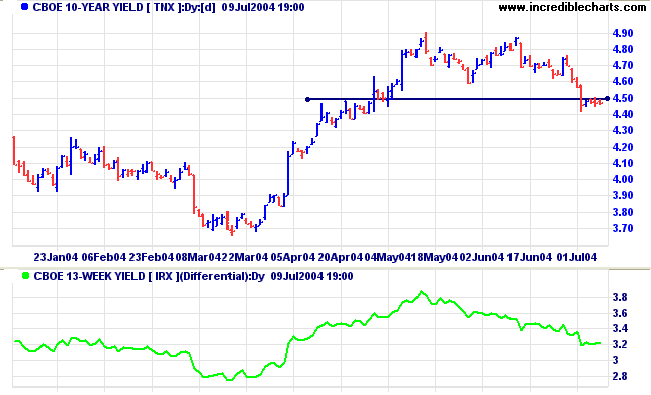
NYSE Bullish Percent The NYSE Bullish Percent Index rose to 65.29%: making a weak Bull Confirmed signal. Treasury yields The yield on 10-year treasury notes is consolidating in a narrow range below 4.50%. A fall below the low of this range will be a strong 'bear' signal. A break back above 4.50% would be bullish. The yield differential (10-year T-notes minus 13-week T-bills) remains at a healthy 3.2%. |
|
Gold
New York: Spot gold closed up at $407.40, confirming the intermediate up-trend with a rise above the previous high of 404.25. Expect a re-test of resistance at $427.25.
New York: Spot gold closed up at $407.40, confirming the intermediate up-trend with a rise above the previous high of 404.25. Expect a re-test of resistance at $427.25.
|
ASX Australia The All Ordinaries continues in a strong up-trend, respecting the first level of support at 3500; a bullish sign. Buyers are firmly in control when troughs do not overlap previous peaks. Twiggs Money Flow signals strong accumulation. |
FREE trial -
Click Here
|
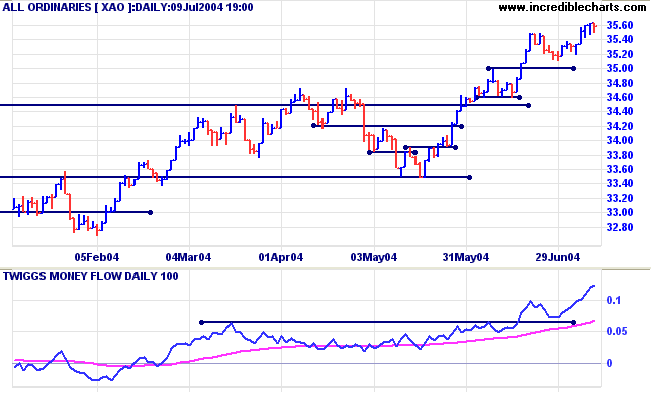
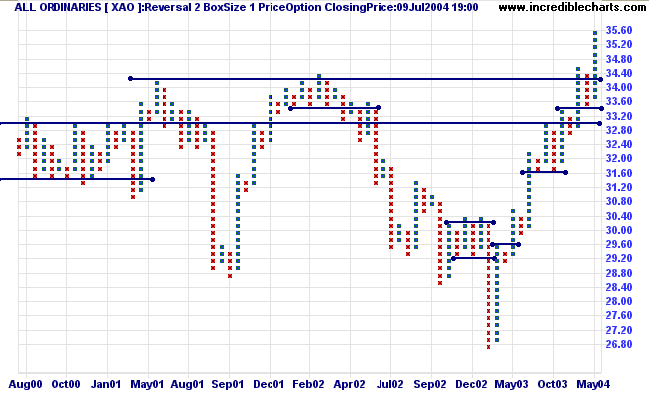
The point and figure chart shows a strong
primary up-trend. Readers should bear in mind that there may
still be a secondary correction that tests support at the
previous high of 3450.
Point & Figure - Breakouts and
Confirmations
In the last article on point and figure trading I covered false breaks (or false catapults as they were called in the early literature). These make trading breakouts a hazardous business: one cannot just place a buy-stop above a resistance level and wait for a breakout. Roughly half to two-thirds of breakouts are going to turn out to be false, with price retreating back below the resistance level. So we need to establish certain criteria that must be met before entering a trade:
In the last article on point and figure trading I covered false breaks (or false catapults as they were called in the early literature). These make trading breakouts a hazardous business: one cannot just place a buy-stop above a resistance level and wait for a breakout. Roughly half to two-thirds of breakouts are going to turn out to be false, with price retreating back below the resistance level. So we need to establish certain criteria that must be met before entering a trade:
- A base must have clearly formed below the resistance level;
- The base must either be rectangular or a recognizable pattern (e.g. triangle, double bottom or head & shoulders);
- Columns of Xs must be rising (there must be a higher low) and a short correction (or consolidation) immediately below the resistance line is a stronger bull signal;
- If neither of the above two is present, wait for confirmation after the breakout, from a pull-back that respects (or makes a false break below) the new support level.
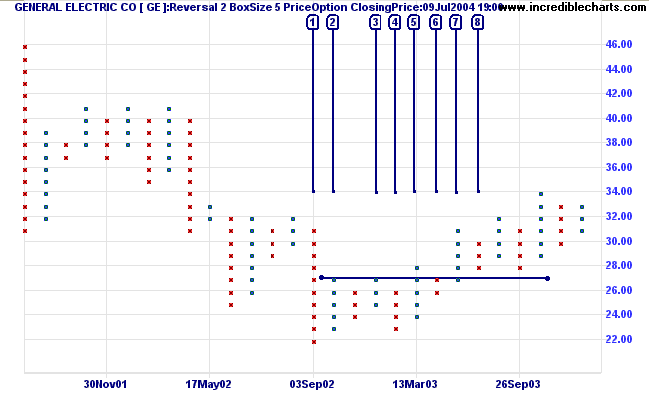
On the General Electric chart we can see that
resistance has formed, with equal highs at [2] and [3]. The base
then evolves into a double bottom, with lows at [1] and [4],
followed by a false breakout at [5]. The short correction below
the resistance level, at [6], is a bullish sign and we can trade
the next break above resistance [7]. Stops should be placed just
below 27.00.
Not that it is needed in this case, but further confirmation is added when the pull-back at [8] respects the new support level. This provides an opportunity for traders to increase their position. GE is now in a slow up-trend, with overlapping peaks and troughs.
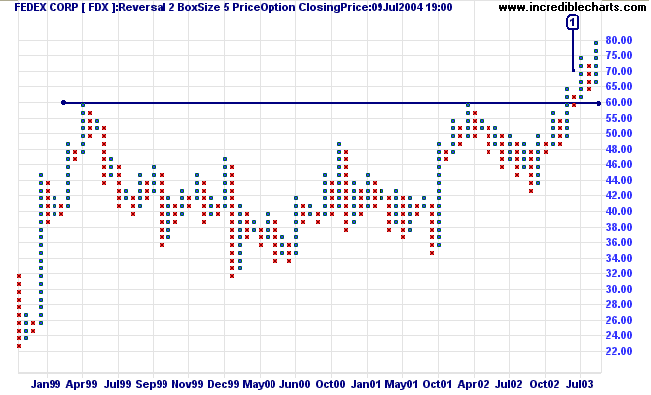
Sometimes we get a breakout where the pull-back fails to respect the new support level. Instead it makes a false break below the new level before rallying strongly. With Fedex below, price makes a false break below 60.00 at [1] before rallying to form a new column of Os. Entry should be taken at the start of the new column, above 60.00. Stop losses should be set below the low of [1].
Not that it is needed in this case, but further confirmation is added when the pull-back at [8] respects the new support level. This provides an opportunity for traders to increase their position. GE is now in a slow up-trend, with overlapping peaks and troughs.
Sometimes we get a breakout where the pull-back fails to respect the new support level. Instead it makes a false break below the new level before rallying strongly. With Fedex below, price makes a false break below 60.00 at [1] before rallying to form a new column of Os. Entry should be taken at the start of the new column, above 60.00. Stop losses should be set below the low of [1].
About
the Trading Diary has been expanded to offer further
assistance to readers, including directions on how to search the
archives.
Colin Twiggs
If you observe a really happy man you will find
him building a boat,
writing a symphony, growing double dahlias in his garden,
or looking for dinosaur eggs in the Gobi Desert.
He will not be searching for happiness
as if it were a collar button that has rolled under the heater.
He will not be striving for it as a goal in itself.
He will have become aware that he is happy
in the course of living life 24 crowded hours of the day.
~ Dr Beran Wolfe
Back Issues
Click here to access the Trading Diary Archives.
Click here to access the Trading Diary Archives.
Back Issues
Access the Trading Diary Archives.

Author: Colin Twiggs is a former investment banker with almost 40 years of experience in financial markets. He co-founded Incredible Charts and writes the popular Trading Diary and Patient Investor newsletters.
Using a top-down approach, Colin identifies key macro trends in the global economy before evaluating selected opportunities using a combination of fundamental and technical analysis.
Focusing on interest rates and financial market liquidity as primary drivers of the economic cycle, he warned of the 2008/2009 and 2020 bear markets well ahead of actual events.
He founded PVT Capital (AFSL No. 546090) in May 2023, which offers investment strategy and advice to wholesale clients.