|
New Diary Format |
|
We are experimenting with a new format for
the Weekly Trading Diary in order to speed up delivery
times, improve the delivery of images (both charts and ads)
and reduce the number of bounced messages (from firewalls
and spam filters). For the next few weeks the Weekly Diary will be published on the website at https://tradingdiary.incrediblecharts.com/trading_diary.php (it may be useful to save this address to your Favorites folder in Internet Explorer). You will receive a short email notifying you when the Diary has been published. Click on the attached link and the Diary will open in your default browser. Please report any difficulties to support. |
Trading Diary
July 3, 2004
These extracts from my daily trading diary
are for educational purposes
and should not be interpreted as investment
advice. Full terms and conditions can be found at Terms
of Use.
USA
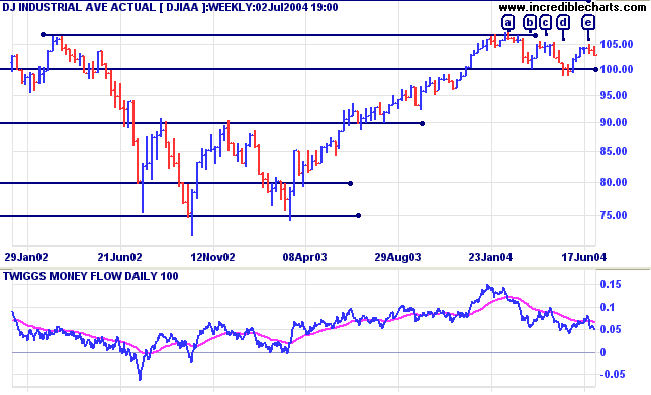
The Dow Industrial Average broke through support at 10300
and we are likely to see another test of the 10000 support
level.
The overall pattern is one of consolidation around the 10000 support level: marginally lower highs at [c] and [e]; marginally lower low at [d]. This pattern can break out in either direction. Obviously, in an up-trend, an upward breakout is more likely but a possible reversal cannot be ignored. We may witness further marginal highs or lows and direction will only be clear when we have a breakout followed by confirmation, with a pull-back that respects the upper or lower border of the pattern.
Twiggs Money Flow is drifting lower.
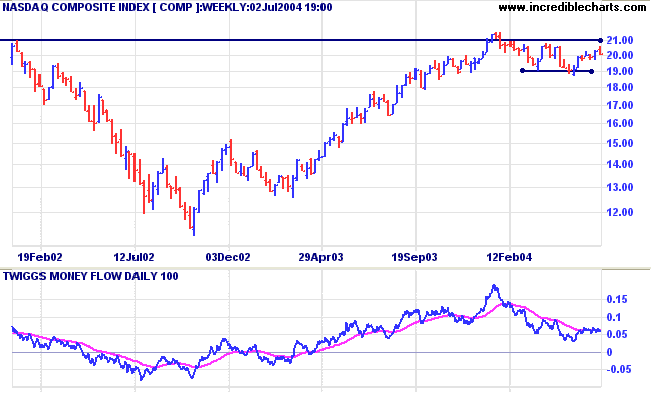
The Nasdaq Composite displays a similar consolidation
pattern to the Dow, with a consolidation between 1900 and
2000.
Twiggs Money Flow is drifting sideways.
Twiggs Money Flow is drifting sideways.
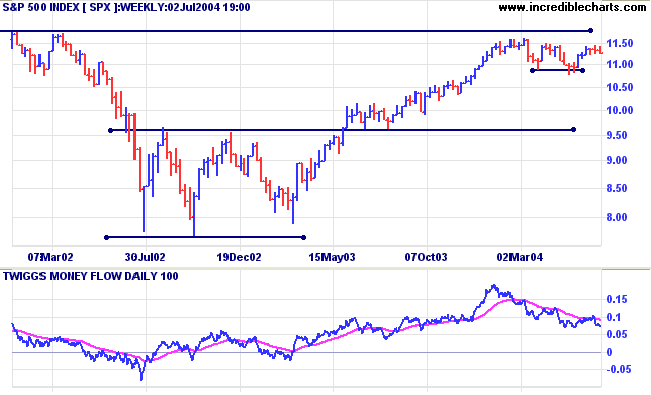
The same pattern also appears on the S&P 500.
Breakouts will need confirmation before they can be relied
upon.
Twiggs Money Flow continues to signal distribution.
Twiggs Money Flow continues to signal distribution.
The point & figure chart shows the consolidation more
clearly, with resistance at 1150 and support at 1080.
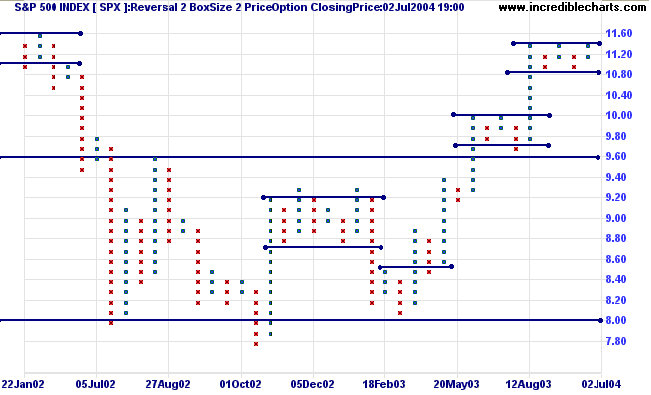
The NYSE
Bullish Percent Index rose to 66.22%: making a weak Bull
Confirmed signal.
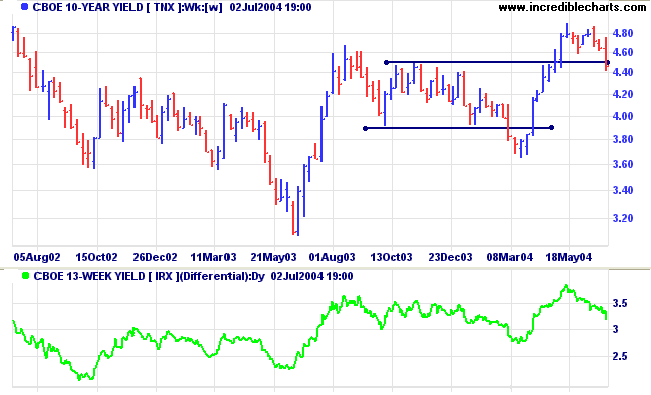
Treasury yields
The yield on 10-year treasury notes is testing support, with a close on Friday below 4.50%. The Fed raised interest rates by a quarter percent as expected but undid the effect, to some extent, by uttering soothing words about increases at a measured pace. The yield differential (10-year T-notes minus 13-week T-bills) is still a healthy 3.2%.
The yield on 10-year treasury notes is testing support, with a close on Friday below 4.50%. The Fed raised interest rates by a quarter percent as expected but undid the effect, to some extent, by uttering soothing words about increases at a measured pace. The yield differential (10-year T-notes minus 13-week T-bills) is still a healthy 3.2%.
Gold
New York: Spot gold closed up at $398.20. The metal has encountered resistance at the 400.00 level. The intermediate up-trend will require further confirmation, with a rise above Monday's high of 404.25.
New York: Spot gold closed up at $398.20. The metal has encountered resistance at the 400.00 level. The intermediate up-trend will require further confirmation, with a rise above Monday's high of 404.25.
Incredible Charts - now with US
Data
|
FREE trial - Click Here
ASX Australia
The recent retracement on the All
Ordinaries encountered support above 3500; a bullish sign. An
up-trend where troughs and preceding peaks do not overlap signals
that buyers are dominant, with sellers unable to drive the index
below the first line of support at the previous high (in this
case at 3500). The reaction on Friday is also encouraging, with a
weak close and strong volume signaling buying support.
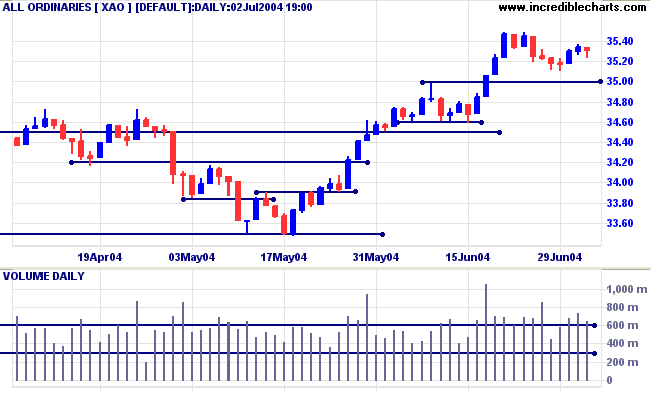
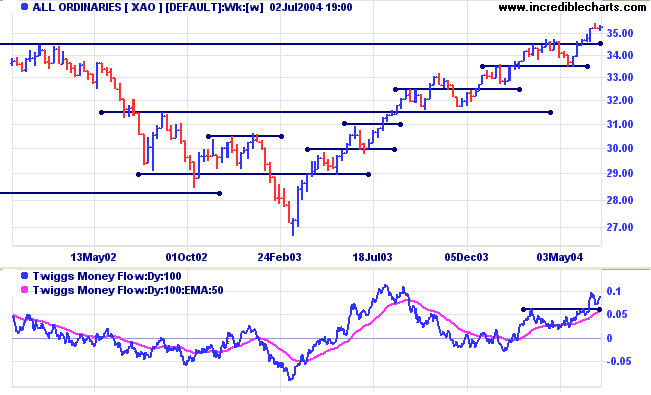
The primary up-trend continues; though readers
should bear in mind that we may still see a secondary correction
later test support at 3450. Twiggs Money Flow continues to signal
strong accumulation.
Point & Figure - Breakouts and Confirmations
We have had a few distractions this week, so I will continue with the series on Point & Figure charts in next week's newsletter.
We have had a few distractions this week, so I will continue with the series on Point & Figure charts in next week's newsletter.
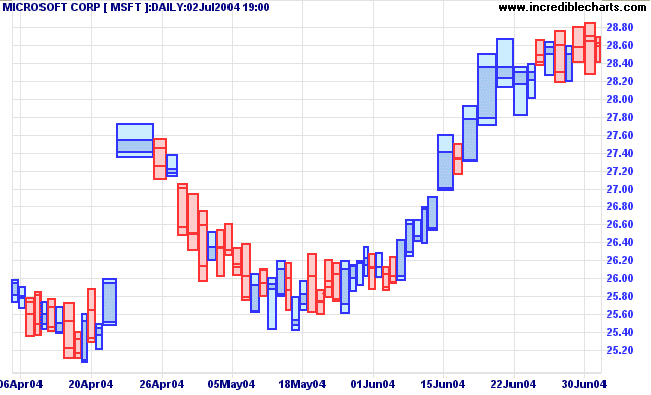
Equivolume - Candlevolume
Notice anything different about the equivolume chart below?
The next update of Incredible Charts will include an improvement suggested by some members several months ago: equivolume bars presented as candlesticks.
On Microsoft we can see that the recent rally is supported by strong volume. The stock then encountered resistance at 28.50 before consolidating in a narrow band between 28.00 and 29.00: a bullish sign.
Notice anything different about the equivolume chart below?
The next update of Incredible Charts will include an improvement suggested by some members several months ago: equivolume bars presented as candlesticks.
- Both Open and Closing prices are displayed;
- The bar is colored blue if the Close is higher than the Open; and
- Red if the Close is lower than the Open.
- If the Close is equal to the open, the bar takes the same color as the previous day.
On Microsoft we can see that the recent rally is supported by strong volume. The stock then encountered resistance at 28.50 before consolidating in a narrow band between 28.00 and 29.00: a bullish sign.
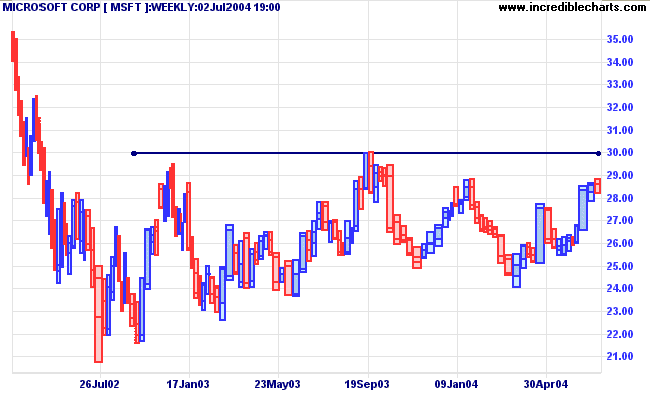
On the weekly chart, Microsoft has formed a broad base, with
resistance at 29.00 to 30.00.
A breakout, confirmed by a pull-back that respects support at these levels, would be a strong bull signal.
Failure to break through resistance at 29.00 would be bearish, while a fall below 24.00, would add further confirmation.
A breakout, confirmed by a pull-back that respects support at these levels, would be a strong bull signal.
Failure to break through resistance at 29.00 would be bearish, while a fall below 24.00, would add further confirmation.
About
the Trading Diary has been expanded to offer further
assistance to readers, including directions on how to search the
archives.
Colin Twiggs
You are successful the moment you start moving toward a worthwhile goal
~ Chuck Carlson
Back Issues
Click here to access the Trading Diary Archives.
Click here to access the Trading Diary Archives.
Back Issues
Access the Trading Diary Archives.

Author: Colin Twiggs is a former investment banker with almost 40 years of experience in financial markets. He co-founded Incredible Charts and writes the popular Trading Diary and Patient Investor newsletters.
Using a top-down approach, Colin identifies key macro trends in the global economy before evaluating selected opportunities using a combination of fundamental and technical analysis.
Focusing on interest rates and financial market liquidity as primary drivers of the economic cycle, he warned of the 2008/2009 and 2020 bear markets well ahead of actual events.
He founded PVT Capital (AFSL No. 546090) in May 2023, which offers investment strategy and advice to wholesale clients.