|
Connection issues |
|
We are still waiting for confirmation but
the recent connection issues appear to have been caused by
a problem at our certificate provider. Members were unable
to fetch an updated CRL (certificate revocation list) from
their servers. This check is performed daily when using
SSL. The problem has been rectified. Users may wish to restore their original settings at Tools >> Internet Options >> Advanced >> Security, if they had Check for server certificate revocation selected. Restart your computer for any changes to take effect. You will also need to create firewall permission for TCP connection to the certificate provider: IP address 195.92.253.137 (port 80). |
Trading Diary
June 26, 2004
These extracts from my daily trading diary
are for educational purposes
and should not be interpreted as investment
advice. Full terms and conditions can be found at Terms
of Use.
USA
The Dow Industrial Average broke above resistance from the
present consolidation pattern on light volume at [3]. Two days
later, heavy selling pressure forced the index to retreat below
the resistance level on strong volume at [5].
Expect a test of support at 10300. If that fails we are likely to see a test of the primary 10000 support level. If that fails ... well, then we have a reversal of the primary trend, but this is not yet a high probability.
Expect a test of support at 10300. If that fails we are likely to see a test of the primary 10000 support level. If that fails ... well, then we have a reversal of the primary trend, but this is not yet a high probability.
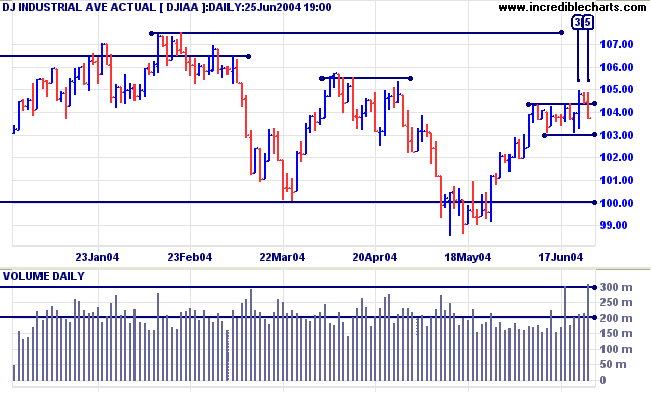
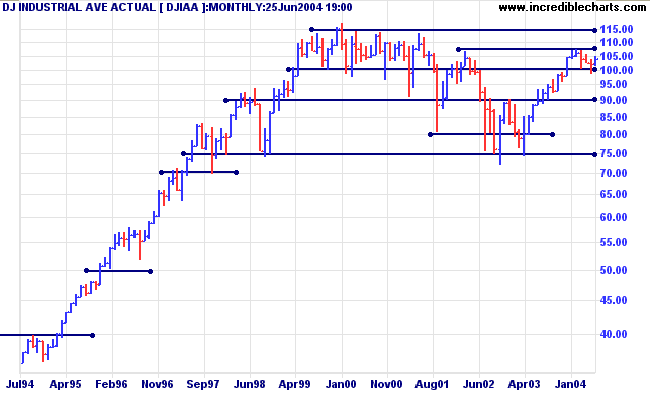
The Dow is consolidating above the 10000 support level. A rise
above 10570 would signal a test of resistance at 11500.
Twiggs Money Flow (not shown), however, continues to signal distribution.
Twiggs Money Flow (not shown), however, continues to signal distribution.
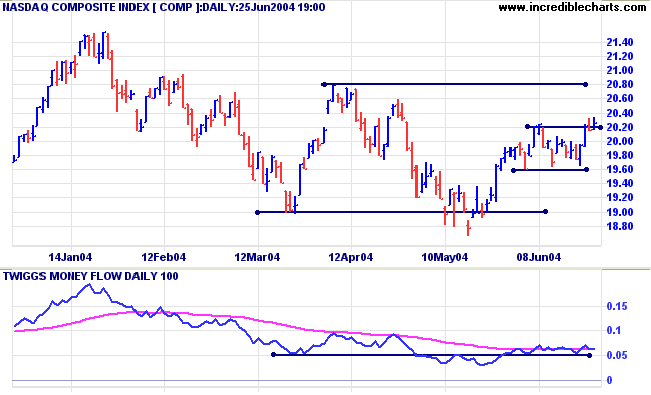
The Nasdaq Composite broke through resistance from the
recent consolidation pattern on strong volume.
Twiggs Money Flow is slowly rising, indicating that some
accumulation is taking place. Expect a test of resistance at
2080. A rise above 2080 would be bullish, while a second peak at
2080 would be a bearish sign (lower double top).
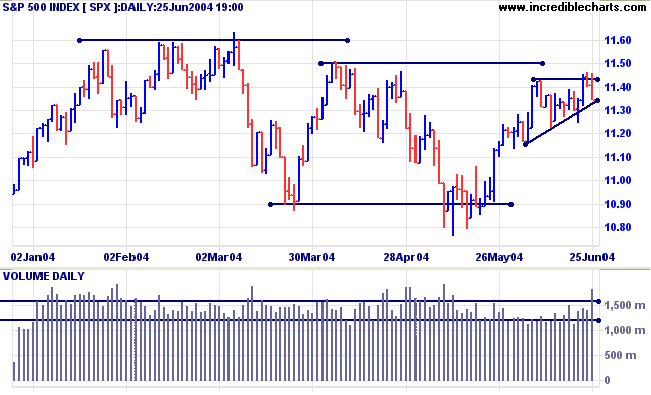
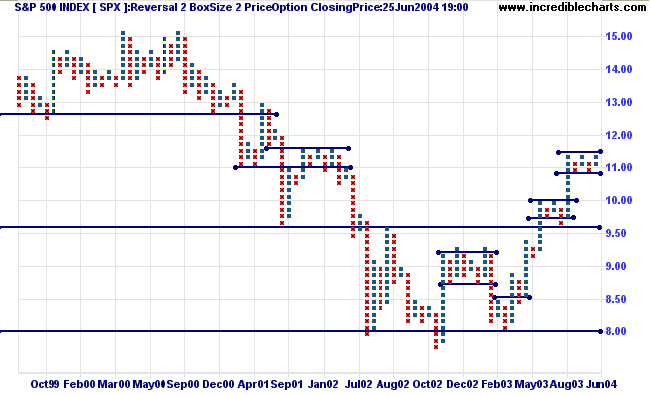
The S&P 500 completed a false break above resistance
before retreating sharply on heavy volume. A breakout below the
recent consolidation pattern would signal a re-test of support at
1090/1080.
So far, the point & figure chart shows just another
consolidation. A clear break above resistance at 1150 would
signal resumption of the primary up-trend; though it may be
advisable to wait for confirmation. A break below 1080 would
be a bear signal, indicating a test of support at 960.
Twiggs Money Flow continues to signal distribution.
Twiggs Money Flow continues to signal distribution.
The NYSE
Bullish Percent Index is at 65.57%; still on Bear Alert
status but close to making a weak Bull Confirmed signal (at 66%).
Treasury yields
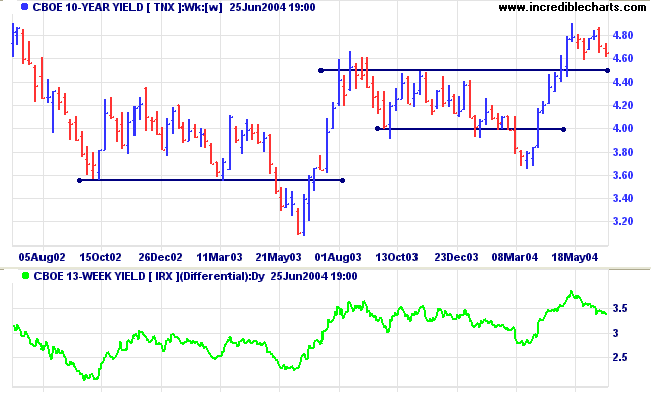
The yield on 10-year treasury notes is consolidating above support at 4.50%. The Fed is expected to raise interest rates by a quarter percent at its Wednesday meeting. A healthy yield differential (10-year T-notes minus 13-week T-bills) of 3.4% reflects imminent rates rises.
The yield on 10-year treasury notes is consolidating above support at 4.50%. The Fed is expected to raise interest rates by a quarter percent at its Wednesday meeting. A healthy yield differential (10-year T-notes minus 13-week T-bills) of 3.4% reflects imminent rates rises.
Gold
New York: Spot gold closed up at $402.10, above the previous high and confirming an intermediate up-trend. Expect a test of resistance at the April high of 427.25.
New York: Spot gold closed up at $402.10, above the previous high and confirming an intermediate up-trend. Expect a test of resistance at the April high of 427.25.
Incredible Charts - now with US
Data
|
FREE trial - Click Here
ASX Australia
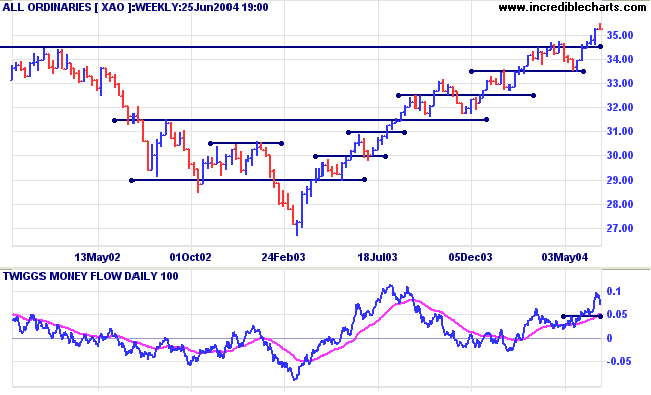
The All Ordinaries consolidated over the
week, after a sharp up-swing. The compressed spring
pattern on Friday (a narrow range with strong volume) warns of a
sharp move. The move is likely to be in an upward direction
despite the low close on Friday: it has taken 4 days to reverse
Monday's gains, signaling strong support.
Expect continued selling until the end of the June 30 financial year as fund managers bury their dead (sell off non-performing stocks that they do not want to appear in their balance sheets) and private investors realize capital losses.
Expect continued selling until the end of the June 30 financial year as fund managers bury their dead (sell off non-performing stocks that they do not want to appear in their balance sheets) and private investors realize capital losses.
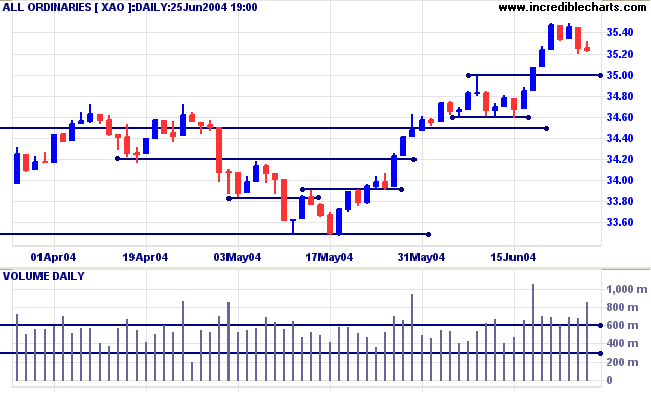
The index has broken through resistance,
signaling continuation of the primary up-trend; though we could
still see a secondary correction later test support at
3450.
Twiggs Money Flow signals strong accumulation.
Twiggs Money Flow signals strong accumulation.
Point & Figure - Breakouts and Confirmations
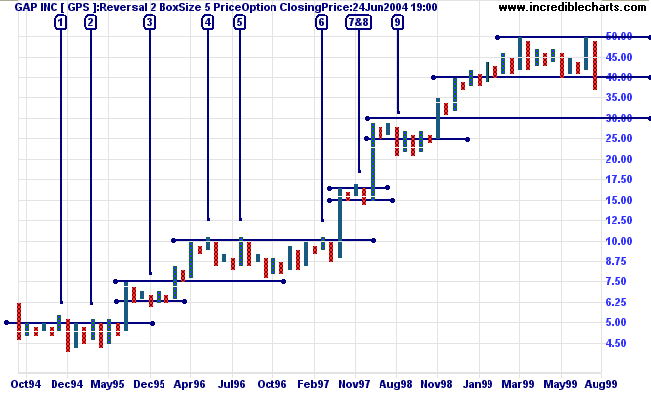
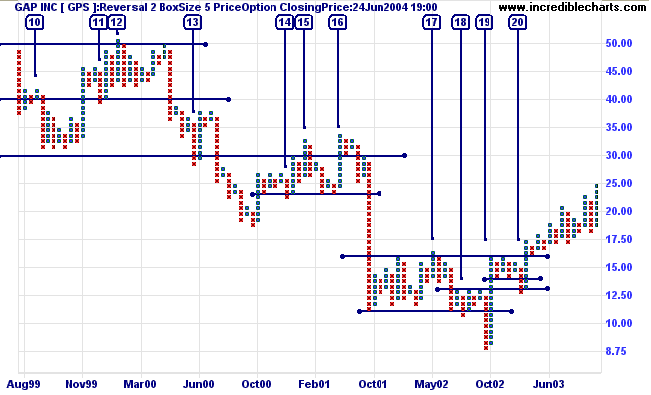
Trading breakouts can be a hazardous business, mainly because of the large number of false breakout signals. A typical example would be the aptly-named GAP Inc. (The Greater Atlantic and Pacific Tea Company - NYSE) charted below. I counted 20 false breakouts over a 10-year period (and there are probably more if you examine the chart closely). GAP is one of a minority of stocks where there has been no financial restructuring requiring dilution adjustments, making it fairly easy to identify historic support and resistance levels (at round numbers).
Trading breakouts can be a hazardous business, mainly because of the large number of false breakout signals. A typical example would be the aptly-named GAP Inc. (The Greater Atlantic and Pacific Tea Company - NYSE) charted below. I counted 20 false breakouts over a 10-year period (and there are probably more if you examine the chart closely). GAP is one of a minority of stocks where there has been no financial restructuring requiring dilution adjustments, making it fairly easy to identify historic support and resistance levels (at round numbers).
What are false breaks?
To explain the cause of false breaks (or false catapults as they were referred to in some of the early literature) let us first re-visit the basics:
A trend that goes straight up without any major corrections or consolidations (a spike) will be prone to failure. The higher that price climbs, the more anxious stock-holders become about locking in their profits: buying support has not been tested. Fearing a major correction, many will join the ranks of sellers at the first signs of a reversal. And fear is a powerful motivator: the further price falls, the more sellers will be panicked into selling, until the devil takes the hindmost.
A consolidation or correction has the opposite effect: it instills confidence in stock-holders. Higher prices are tested by sellers and buyers commitment is proven, establishing a solid base for further gains.
Support and resistance at these consolidations are not the brick walls that some would have us believe. They can be fairly elastic: absorbing the energy of a rally or correction before returning to their original position. Rather like the strings of a tennis racket. We may see several forays across a line of support or resistance, all of which are repulsed, before sufficient energy is accumulated to break through.
Some of these forays are initiated by professional (short-term) traders in attempt to shake out stop-losses and accumulate a position at lower prices. Brokers also stand to benefit from the additional brokerage when buy-stops are triggered as price breaks through a major resistance level. And they get a second bite at your trading capital when price retreats, triggering stop-losses.
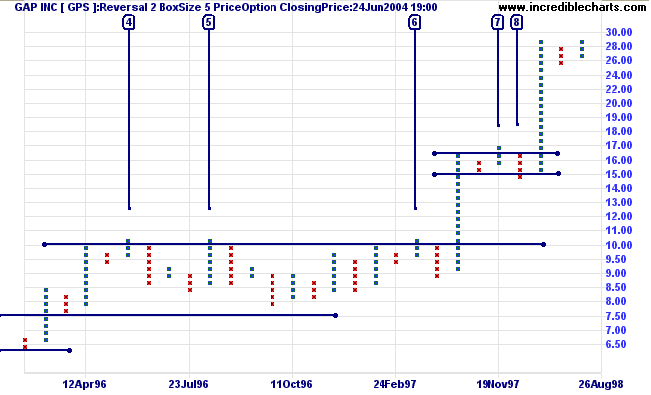
Placing wider stops at the point of entry?
Placing wider stops, below the opposite border of the consolidation pattern, does not always help. And when your stops are triggered, the losses will be far more expensive.
A false break is likely to be followed by a test of the opposite border of the consolidation pattern - and you may face a similar situation there as well. See [7] and [8] on the chart below.
More on breakouts and confirmations next week.....
About
the Trading Diary has been expanded to offer further
assistance to readers, including directions on how to search the
archives.
Colin Twiggs
Was Mohammed Ali ever upstaged?
Ali was on a plane when a stewardess asked him to fasten his seat belt.
He replied "Superman don't need no seat belt".
The stewardess told the champ "Superman don't need no plane!"
Back Issues
Click here to access the Trading Diary Archives.
Click here to access the Trading Diary Archives.
Back Issues
Access the Trading Diary Archives.

Author: Colin Twiggs is a former investment banker with almost 40 years of experience in financial markets. He co-founded Incredible Charts and writes the popular Trading Diary and Patient Investor newsletters.
Using a top-down approach, Colin identifies key macro trends in the global economy before evaluating selected opportunities using a combination of fundamental and technical analysis.
Focusing on interest rates and financial market liquidity as primary drivers of the economic cycle, he warned of the 2008/2009 and 2020 bear markets well ahead of actual events.
He founded PVT Capital (AFSL No. 546090) in May 2023, which offers investment strategy and advice to wholesale clients.