|
Connection Problems |
|
Incredible Charts communicates via SSL
(HTTPS) with the data servers. If you experience any connection problems, please open Internet Explorer, go to Tools >> Internet Options >> Advanced >> Security and ensure that Check for server certificate revocation is not checked. You will need to restart your computer for any changes to take effect. We are investigating the cause of the problem. |
Trading Diary
June 19, 2004
These extracts from my daily trading diary
are for educational purposes
and should not be interpreted as investment
advice. Full terms and conditions can be found at Terms
of Use.
USA
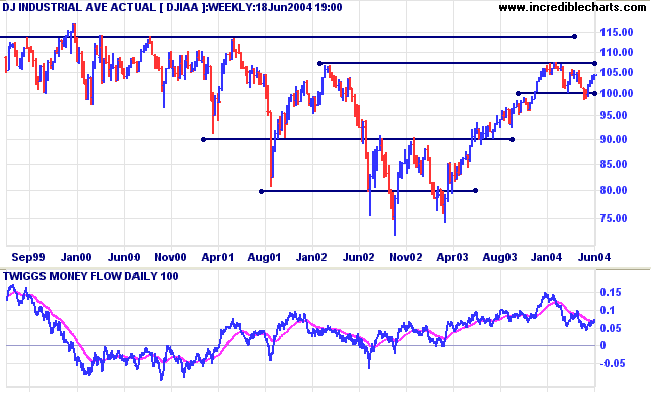
The Dow Industrial Average is forming a
pennant, normally a continuation pattern in a trend. Further
bullish signs are:
- increased volume on the two up-days at [1] and [4]; and
- equal highs with rising lows, creating an "ascending" pattern.
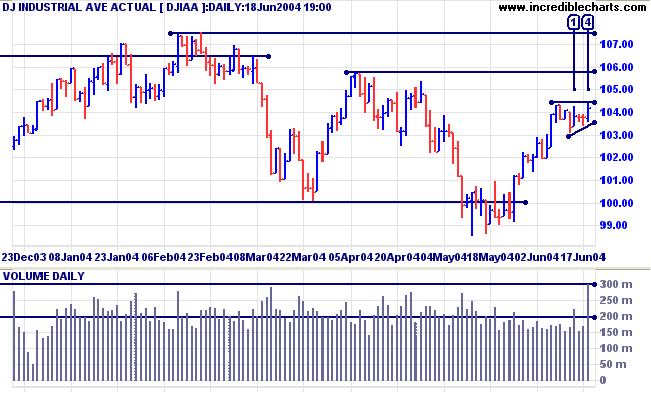
The Dow is undergoing a period of consolidation which may well
resolve as a mid-point consolidation. A rise above 10570 would
signal resumption of the primary up-trend.
Twiggs Money Flow has crossed above its signal line but is still trending downwards.
Twiggs Money Flow has crossed above its signal line but is still trending downwards.
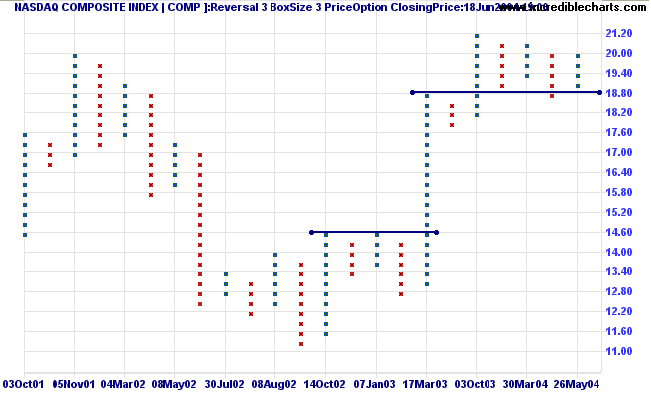
The Nasdaq Composite is consolidating above 1900. The
false break below this level has been followed by a rally which
is likely to test resistance at the opposite extreme of the
pattern. Lower highs are a bearish sign but descending patterns
are unreliable patterns in an up-trend (that is not
over-extended). Low volumes on the daily chart signal
ambivalence from buyers and sellers.
Twiggs Money Flow continues to trend downwards, signaling continued distribution.
Twiggs Money Flow continues to trend downwards, signaling continued distribution.
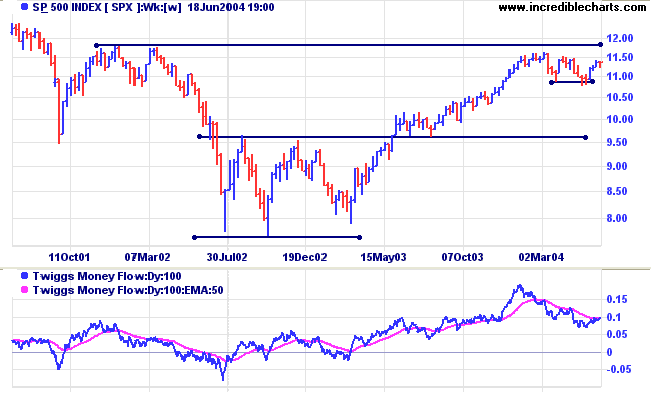
The S&P 500 appears fairly weak in the short-term,
with increased volume and a weak close highlighting a failed
attempt to break above Monday's high. Failure to break above
resistance at 1150 would signal another test of support at
1090/1080.
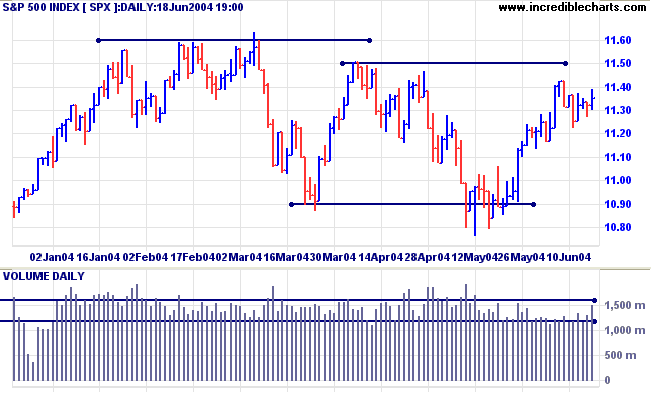
The outcome of the last two months consolidation pattern is still
uncertain.
A clear break above resistance at 1150 would signal resumption of the primary up-trend; though it may be advisable to wait for confirmation. A break below 1080 would be a bear signal, indicating a possible test of support at 960.
Twiggs Money Flow continues to signal distribution.
A clear break above resistance at 1150 would signal resumption of the primary up-trend; though it may be advisable to wait for confirmation. A break below 1080 would be a bear signal, indicating a possible test of support at 960.
Twiggs Money Flow continues to signal distribution.
The NYSE
Bullish Percent Index is at 64.03%; still on Bear Alert
status.
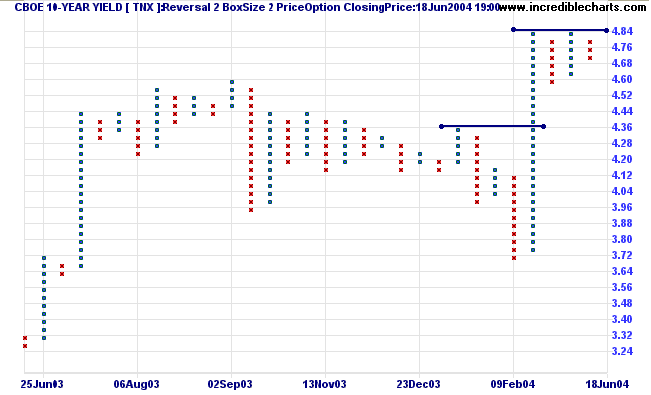
Treasury yields
The yield on 10-year treasury notes is down slightly at 4.710%. The yield is consolidating below resistance at 4.84% after the strong breakout. A yield differential (10-year T-notes minus 13-week T-bills) of 3.5% reflects an imminent rates rise.
The yield on 10-year treasury notes is down slightly at 4.710%. The yield is consolidating below resistance at 4.84% after the strong breakout. A yield differential (10-year T-notes minus 13-week T-bills) of 3.5% reflects an imminent rates rise.
Gold
New York: Spot gold made a late rally to $394.90, forming a higher low. A rise above 397.20 would signal the start of an intermediate up-trend with a possible test of resistance at the April high of 427.25.
New York: Spot gold made a late rally to $394.90, forming a higher low. A rise above 397.20 would signal the start of an intermediate up-trend with a possible test of resistance at the April high of 427.25.
Incredible Charts - now with US
Data
|
FREE trial - Click Here
ASX Australia
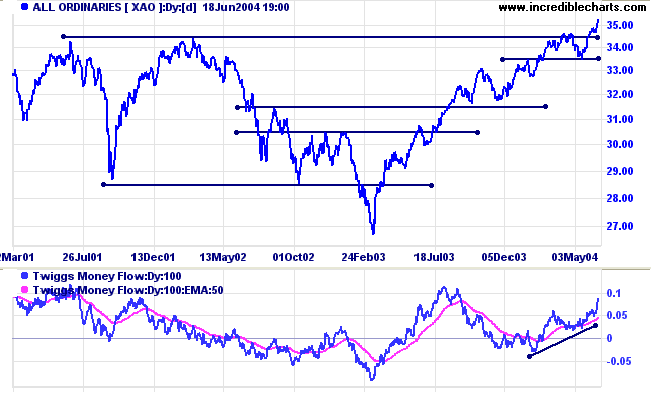
The All Ordinaries re-tested support at
[1], low volume and a weak close indicating an absence of selling
pressure. Price then rallied on strong volume; breaking through
resistance at 3500 on exceptional volume; and continuing to a new
high of 3523 on Friday.
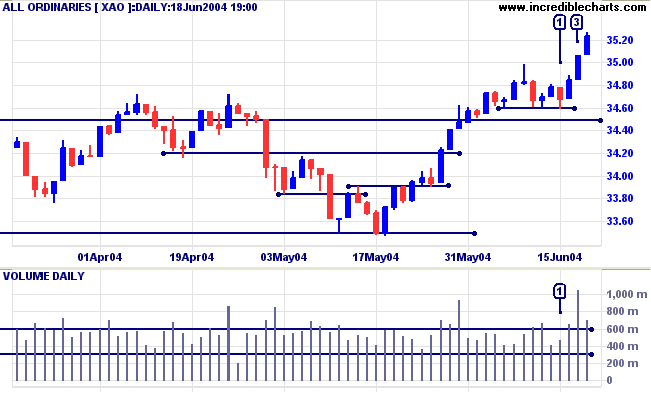
We now have confirmation of the breakout, with
a (short-term) pull-back respecting the new support level. The
intermediate and primary trends are both up; though we could
later see a secondary correction testing the new support level of
3450.
Twiggs Money Flow is rising fast, indicating strong accumulation.
Twiggs Money Flow is rising fast, indicating strong accumulation.
Point & Figure - Triangles
Triangles represent consolidation during an up- or down-trend: when buyers and sellers are, at least for a while, in equilibrium. Breakouts offer significant entry points, either on a continuation or on reversal of the trend.
For a valid triangle there must be at least two retracements counter to the prevailing trend:
Symmetrical triangles
Symmetrical triangles present a series of rising lows and falling highs. Breakouts may occur in either direction, though the pattern is more likely to resolve in a continuation unless a trend is over-extended.
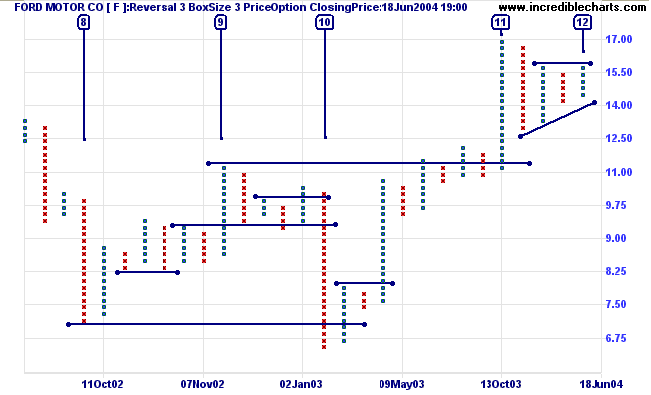
Ford Motor Co. [F] below has formed a triangle between [11] and [12] in the latest up-trend. There are two retracements (red columns) counter to the direction of the trend so this is a valid pattern.
Back Issues
Triangles represent consolidation during an up- or down-trend: when buyers and sellers are, at least for a while, in equilibrium. Breakouts offer significant entry points, either on a continuation or on reversal of the trend.
For a valid triangle there must be at least two retracements counter to the prevailing trend:
- Two columns of Os in an up-trend; or
- Two columns of Xs in a down-trend.
Symmetrical triangles
Symmetrical triangles present a series of rising lows and falling highs. Breakouts may occur in either direction, though the pattern is more likely to resolve in a continuation unless a trend is over-extended.
Ford Motor Co. [F] below has formed a triangle between [11] and [12] in the latest up-trend. There are two retracements (red columns) counter to the direction of the trend so this is a valid pattern.
- An upward breakout entry would be made if the column at [12] rises above the high of the previous column. Stops would be placed below 14.00: the low of the last red column.
- A downward breakout would occur if price reverses back below 14.00. On a trend reversal it is advisable to wait for confirmation: otherwise you could get suckered by a false break.
Ascending and Descending
triangles
Ascending and descending triangles are treated in the same way as on a normal bar chart:
Ascending and descending triangles are treated in the same way as on a normal bar chart:
-
Ascending triangles are strong bull
signals in an up-trend that is not over-extended. Also in
an extended down-trend. In a normal down-trend, the pattern
is less certain: often resulting in a bull trap.
Breakout entries are taken when price rises above the resistance level. Stops are placed below the most recent low.
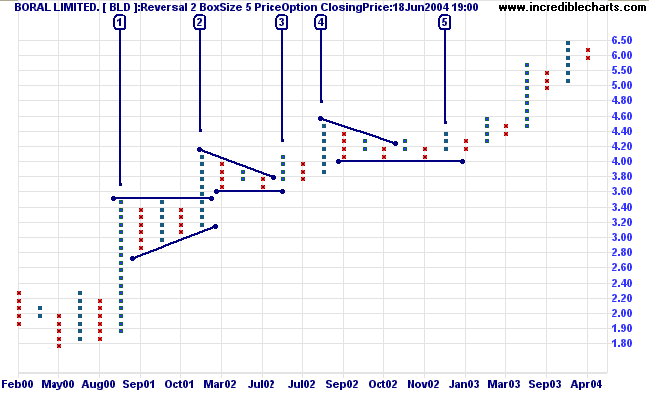
Descending triangles are also visible on the
above chart: between [2] and [3] and from [4] to [5]. Both
patterns resolve in the direction of the primary trend. BLD
continues to display a strong up-trend.
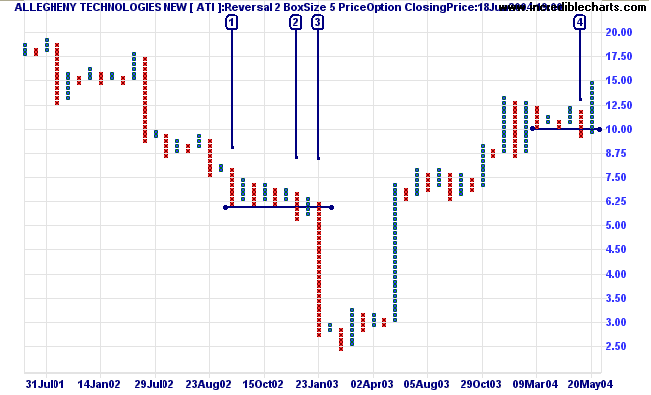
Allegheny Technologies [ATI] below displays a descending triangle in a down-trend: at [1] to [3]. Observe how the breakout at [2] retreats back above the previous support level. Price then forms another lower high, followed by a strong downward break at [3]: a fine bearish catapult.
-
Descending triangles are strong bear
signals in a down-trend (when not over-extended). Also in
an extended up-trend. In a normal up-trend, the pattern is
less certain; watch out for bear traps.
Breakout entries are taken when price falls below the support level. Stops are placed above the most recent high.
Allegheny Technologies [ATI] below displays a descending triangle in a down-trend: at [1] to [3]. Observe how the breakout at [2] retreats back above the previous support level. Price then forms another lower high, followed by a strong downward break at [3]: a fine bearish catapult.
Note also the bear trap at [4] before a strong upward breakout
to 15.00.
More on breakouts and confirmations next week.....
More on breakouts and confirmations next week.....
Basic point and figure chart patterns are explained at the
Trading Guide: P&F Chart Patterns.
About
the Trading Diary has been expanded to offer further
assistance to readers, including directions on how to search
the archives.
Colin Twiggs
. . . So often do the spirits Of great events
stride on before the events,
And in to-day already walks to-morrow.
~ Samuel Taylor Coleridge
And in to-day already walks to-morrow.
~ Samuel Taylor Coleridge
Back Issues
Click here to access the Trading Diary Archives.
Click here to access the Trading Diary Archives.
Back Issues
Access the Trading Diary Archives.

Author: Colin Twiggs is a former investment banker with almost 40 years of experience in financial markets. He co-founded Incredible Charts and writes the popular Trading Diary and Patient Investor newsletters.
Using a top-down approach, Colin identifies key macro trends in the global economy before evaluating selected opportunities using a combination of fundamental and technical analysis.
Focusing on interest rates and financial market liquidity as primary drivers of the economic cycle, he warned of the 2008/2009 and 2020 bear markets well ahead of actual events.
He founded PVT Capital (AFSL No. 546090) in May 2023, which offers investment strategy and advice to wholesale clients.