|
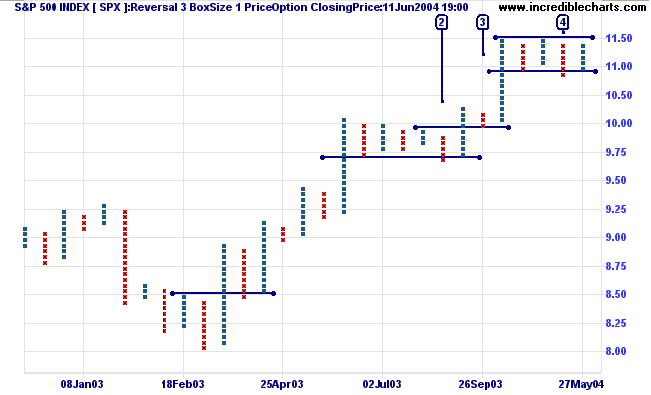
S&P 500 [SPX] data history |
|
The S&P 500 data history has been extended to 24
years |
Trading Diary
June 12, 2004
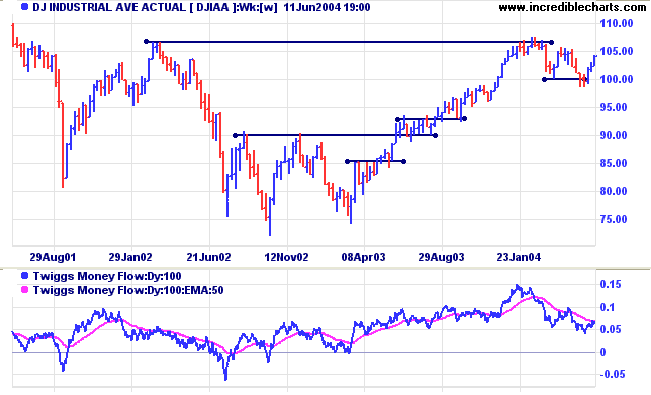
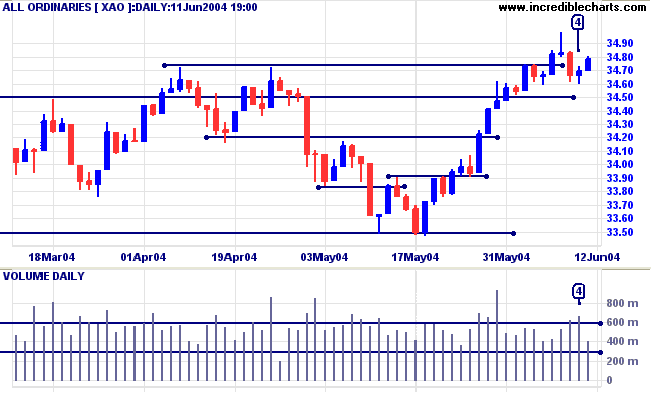
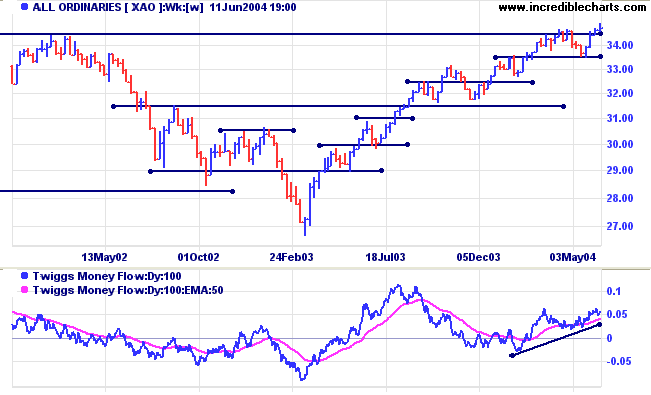
But Twiggs Money Flow continues to signal distribution.
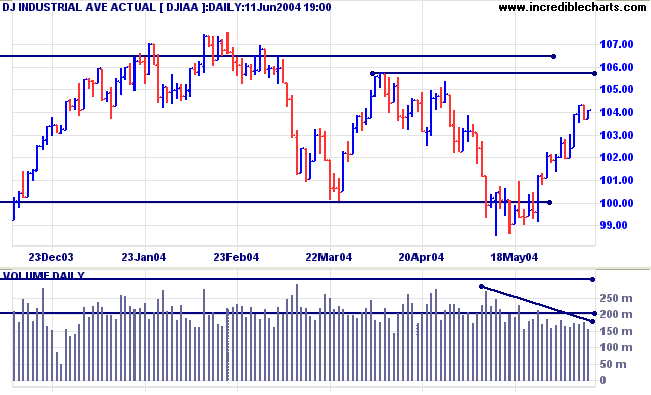
Declining volume signals a lack of commitment from buyers.
Twiggs Money Flow continues to show distribution.
A clear break above resistance at 1150 would signal resumption of the primary up-trend; though it may be advisable to wait for confirmation, as at [3] on the last breakout.
Twiggs Money Flow continues to signal distribution.
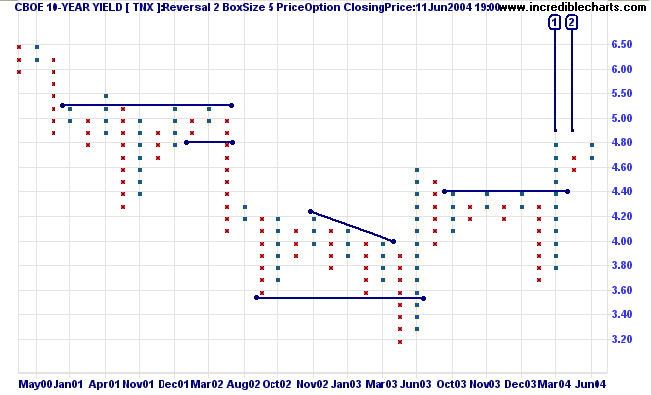
The yield on 10-year treasury notes is at 4.791%. The short retracement [2] after the breakout [1] above resistance indicates a healthy primary up-trend.
The yield differential (10-year T-notes minus 13-week T-bills) at 3.5% reflects imminent rates increases.
New York: Spot gold closed down at $384.90, below resistance at 390. Expect a bearish consolidation or slow down-trend.
The next (intermediate) support level is at the May low of 375.
Incredible Charts - now with US
Data
|
FREE trial - Click Here
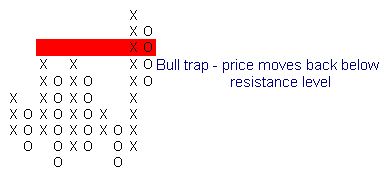
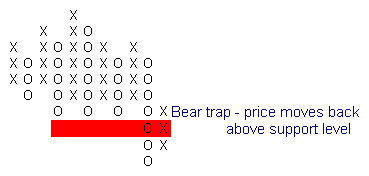
One of the most reliable patterns. Bull traps occur when an upward breakout retreats back below a resistance level. Bear traps occur when a downward breakout retreats back above a support level.
Bull Traps
- Bull traps should be traded in a down-trend.
- They may also signal reversal after an extended up-trend.
- Go short when price falls back below the resistance level.
- Bear traps should be traded in an up-trend.
- They may also signal reversal after an extended down-trend.
- Go long when price rises above the support level.
Bull and bear traps (and false breaks) often occur in longer time frames as well.
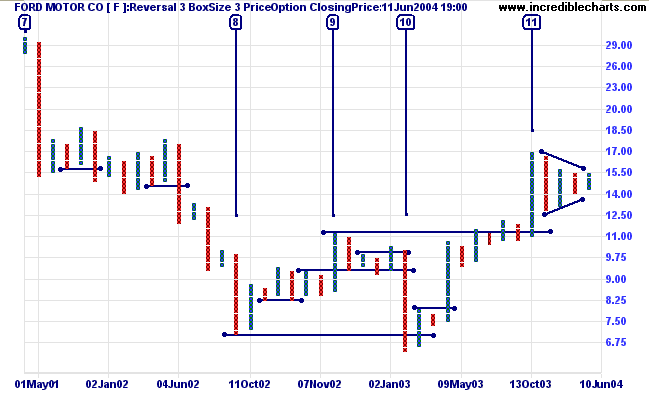
Ford Motor Co. displays a bull trap that took more than a year to complete.
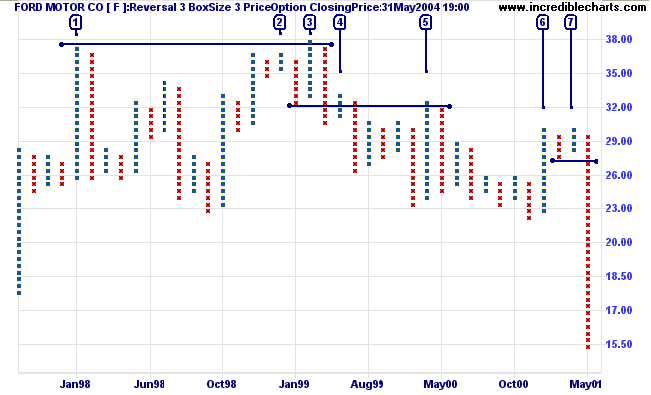
- Price spikes up to a new high, in early 1998, but quickly retraces.
- Resistance forms just below the previous high. The strong following correction is a bearish sign.
- The Bull trap: Price rallies to a marginal new high but then retreats below the resistance level.
- A short retracement confirms the trend change.
- An equal lower high confirms resistance has formed at 32.00: the low before [3]. A strong bear signal.
- Another attempted rally peters out.
- Equal highs in a down-trend are a strong bear signal; and are followed by a long downward spike.
More on triangle patterns next week....
whereupon it is ripe for a bust.
~ George Soros
Click here to access the Trading Diary Archives.
Back Issues

Author: Colin Twiggs is a former investment banker with almost 40 years of experience in financial markets. He co-founded Incredible Charts and writes the popular Trading Diary and Patient Investor newsletters.
Using a top-down approach, Colin identifies key macro trends in the global economy before evaluating selected opportunities using a combination of fundamental and technical analysis.
Focusing on interest rates and financial market liquidity as primary drivers of the economic cycle, he warned of the 2008/2009 and 2020 bear markets well ahead of actual events.
He founded PVT Capital (AFSL No. 546090) in May 2023, which offers investment strategy and advice to wholesale clients.