|
Chart Complete Data |
|
To display complete 10-year data histories, select |
Trading Diary
May 22, 2004
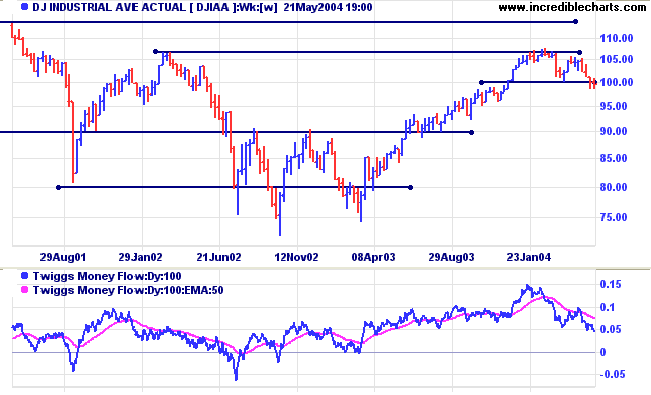
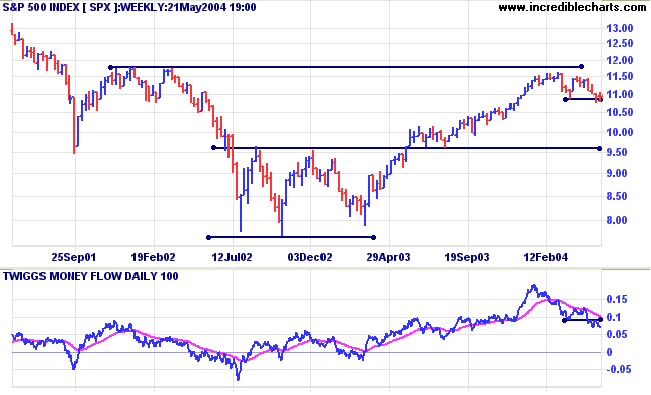
Twiggs Money Flow is bearish.
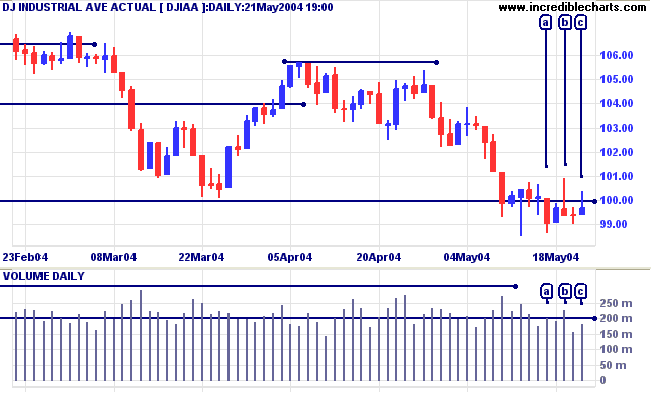
Twiggs Money Flow displays a strong bear signal.
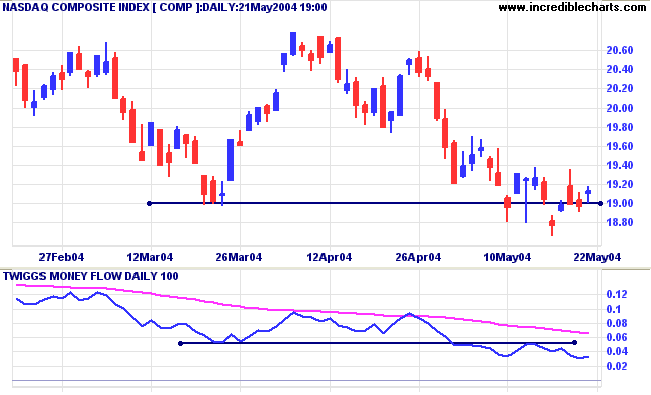
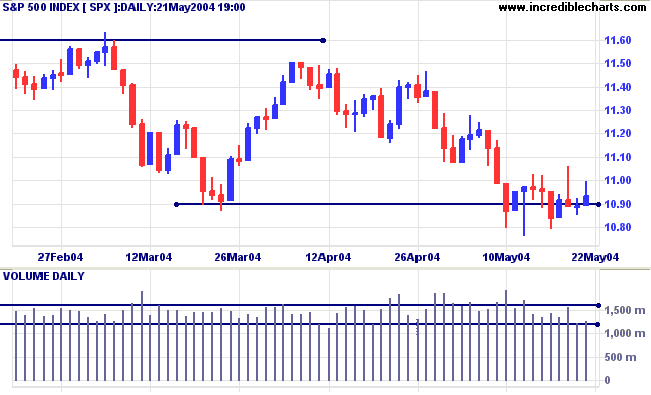
Twiggs Money Flow shows a strong bear signal.
The Chartcraft Bullish Percent Index is on Bear Alert status, having eased to 59.13%.
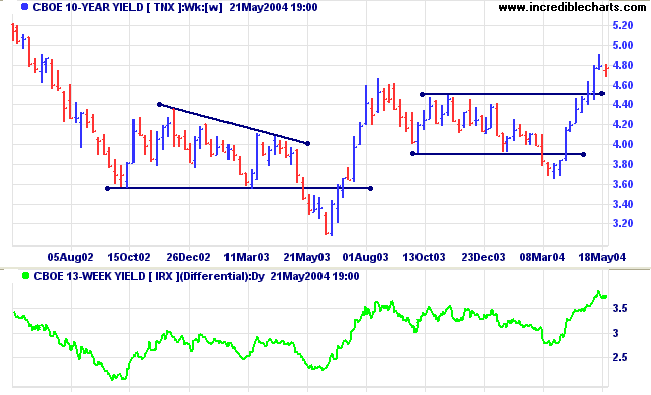
The yield on 10-year treasury notes retraced to 4.764%. A correction that respects support at 4.50% will confirm the strong primary up-trend.
The yield differential (10-year T-notes minus 13-week T-bills) at 3.8% reflects expectations that rates will increase soon.
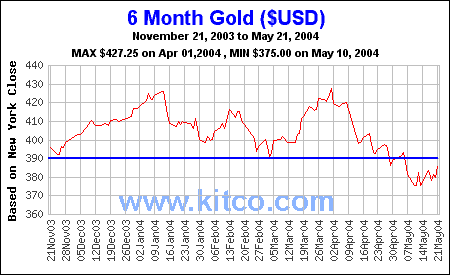
New York: Spot gold recovered slightly to $384.30. Expect the retracement to test resistance at $390.
The primary trend continues downwards.
Incredible Charts - now with US
Data
|
FREE trial - Click Here
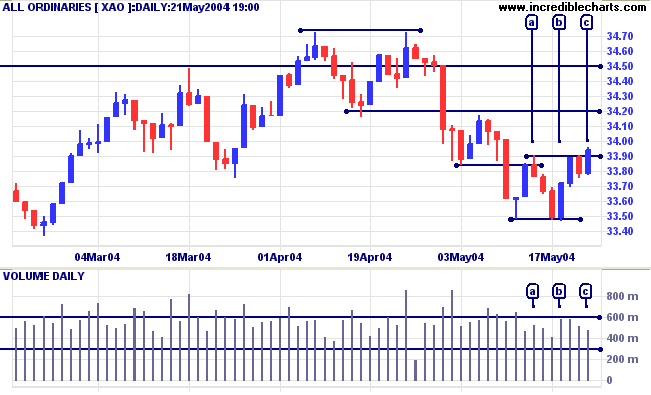
Reversal below 3390 on Monday will signal another test of support at 3350.
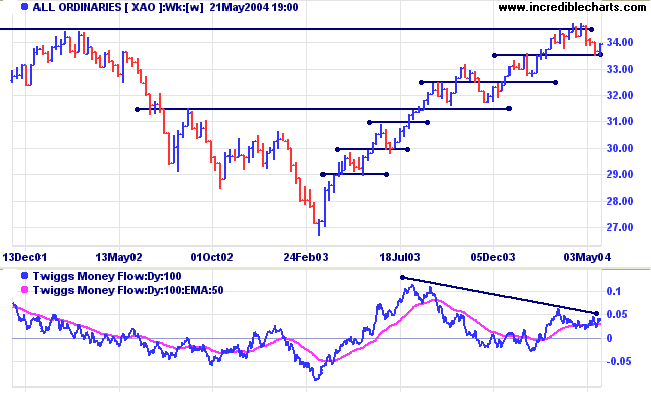
A fall below support at 3150 would signal reversal.
Twiggs Money Flow continues to display a bearish divergence, signaling long-term weakness.
There is a detailed explanation of the three pricing methods at Point and Figure Construction, but here is a brief summary:
- The High/Low method plots highs in an up-trend and lows in a down-trend;
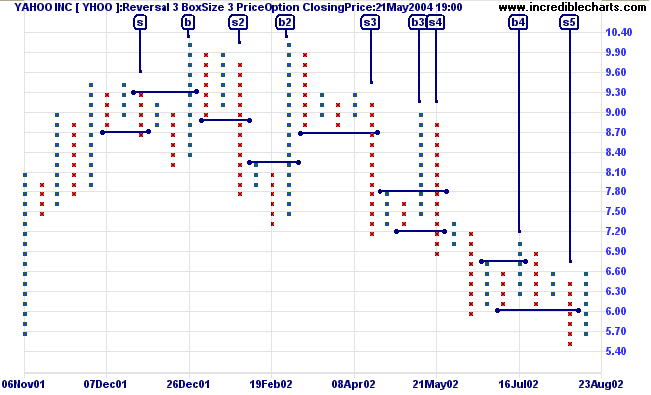
- Closing Price method plots only changes in closing price;
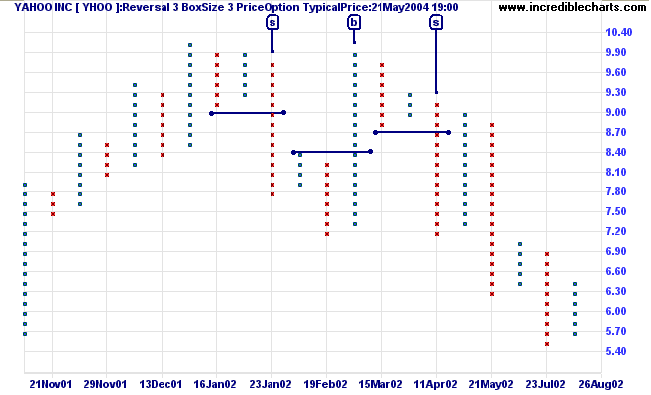
- Typical Price calculates the average of High, Low and Closing Price.
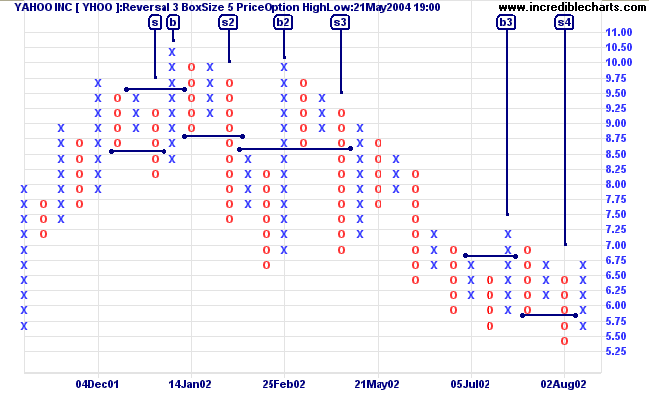
The High/Low method attempts to approximate the early DeVilliers method of point and figure charting which used intra-day data. With highs in an up-trend, and lows in a down-trend, the method is more responsive to trend changes. It is suited to short-term point and figure charts: there are too many false signals for long-term charting.
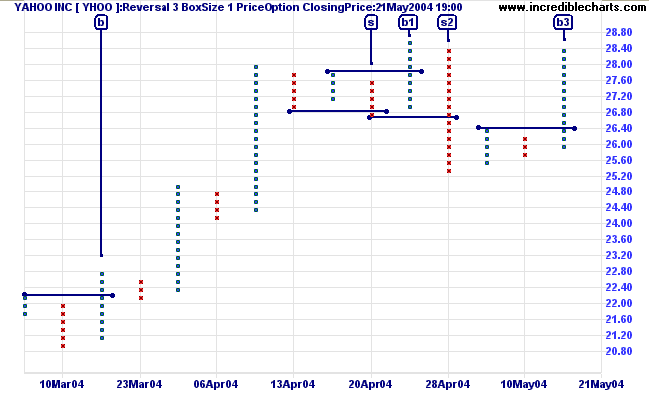
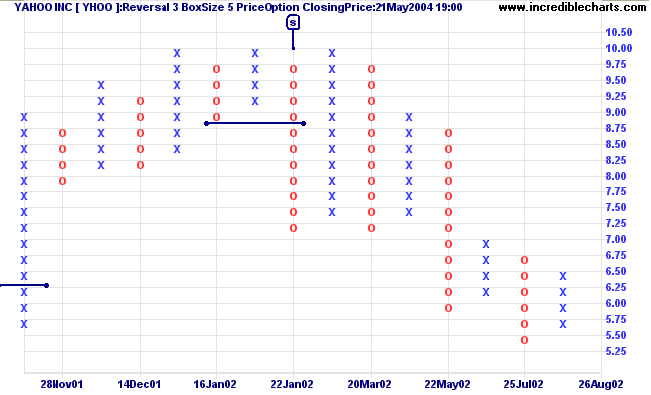
Compare the High/Low and Closing Price methods with Yahoo Inc [YHOO]:
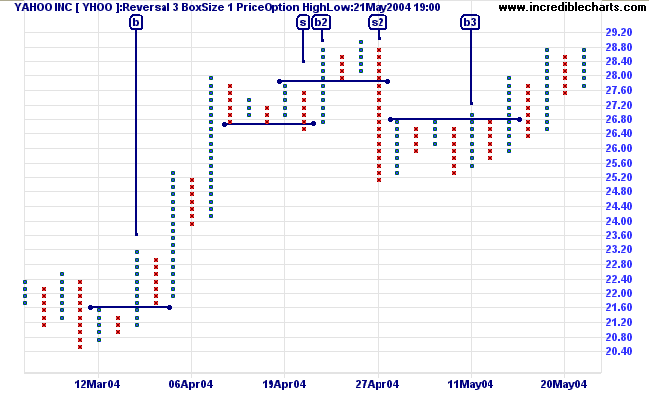
Generally, High/Low signals are earlier.
| Buy/Sell Signals | |
| Buy [b]: | When a column of Xs rises above the preceding column of Xs |
| Sell [s]: | When a column of Os falls below the preceding column of Os |
Closing price is more suited to longer-term charts; eliminating false signals caused by intra-day fluctuations.
This time we take a 5-year chart of Yahoo Inc [YHOO], with a box size of 5 and reversal of 3, and zoom in on the top pattern at the end of 2002:
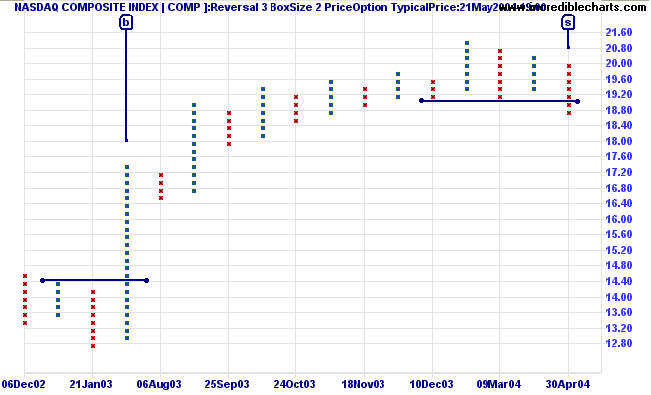
Typical price uses a single daily price calculated as (High + Low + Close)/3. This offers further smoothing, enabling us to use a smaller, more responsive box size. Although not widely used, the method offers clearer signals, when employed on long-term charts, than the more commonly accepted Closing Price method.
Believing that personal gain is made by crushing others;
Worrying about things that cannot be changed or corrected;
Insisting that a thing is impossible because we cannot accomplish it;
Refusing to set aside trivial preferences;
Neglecting development and refinement of the mind;
Attempting to compel others to believe and live as we do.
- Marcus Tullius Cicero.
Click here to access the Trading Diary Archives.
Back Issues

Author: Colin Twiggs is a former investment banker with almost 40 years of experience in financial markets. He co-founded Incredible Charts and writes the popular Trading Diary and Patient Investor newsletters.
Using a top-down approach, Colin identifies key macro trends in the global economy before evaluating selected opportunities using a combination of fundamental and technical analysis.
Focusing on interest rates and financial market liquidity as primary drivers of the economic cycle, he warned of the 2008/2009 and 2020 bear markets well ahead of actual events.
He founded PVT Capital (AFSL No. 546090) in May 2023, which offers investment strategy and advice to wholesale clients.