|
Free trial expiry |
|
US data updates will not be delayed (on
Incredible Charts free version) until the US subscription
page is available. NYSE, NASDAQ, AMEX and indices are updated at 8.00 p.m. EST. Click Help >> About to check your membership/free trial status. |
Trading Diary
May 15, 2004
These extracts from my daily trading diary
are for educational purposes
and should not be interpreted as investment
advice. Full terms and conditions can be found at Terms
of Use.
USA
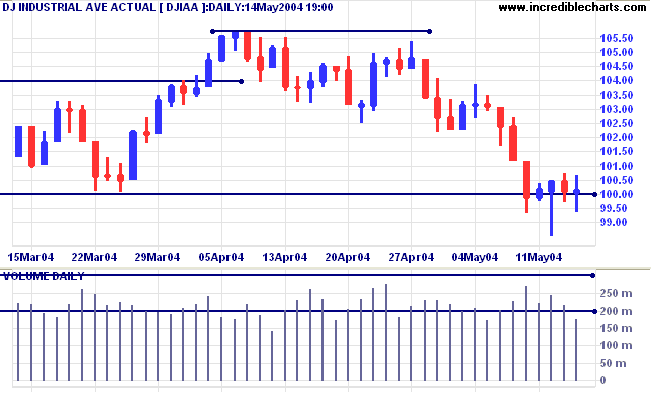
The Dow Industrial Average penetrated the key 10000
support level several times through the week, but each time
failed to hold below the line. Falling volume signals absence of
selling pressure, and we may see a short-term rally.
Consolidation above the support level would be a bear signal, as
would a fall that holds below 10000 for two/more consecutive
days.
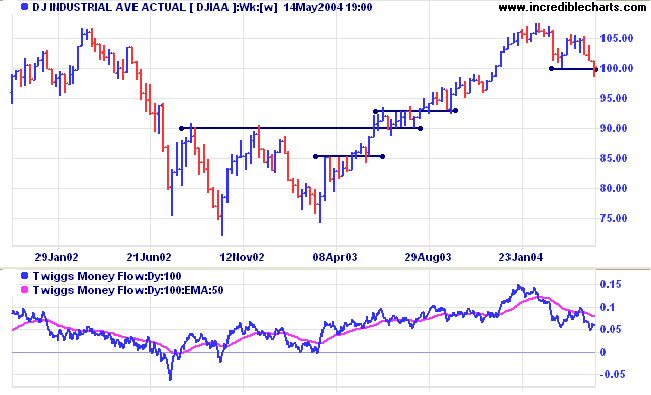
Twiggs Money Flow is bearish; hanging below its signal line.
A fall below current lows would be a strong bear signal.
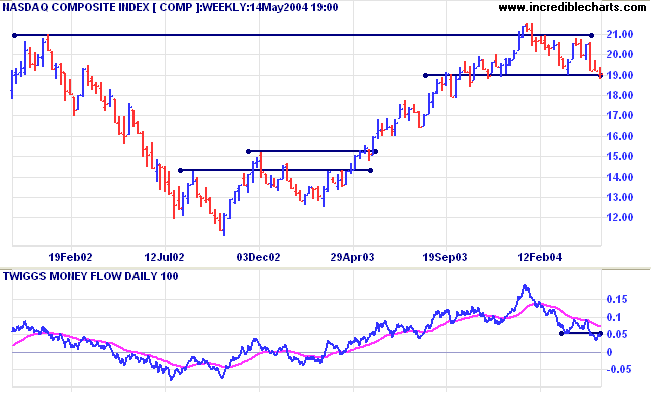
The Nasdaq Composite has also failed to hold below the key
1900 level, closing the week at 1904. Falling volume indicates a
lack of selling pressure, but Twiggs Money Flow shows a strong
bear signal.
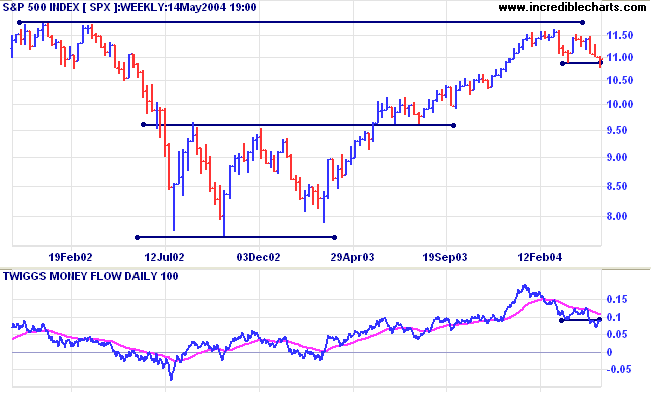
The S&P 500 broke support at 1090/1087 but failed to
hold below this level. Buying support is evident with strong
volume and weak closes on the penetration attempts. A break below
this level will signal a likely test of support at 1000 to 960.
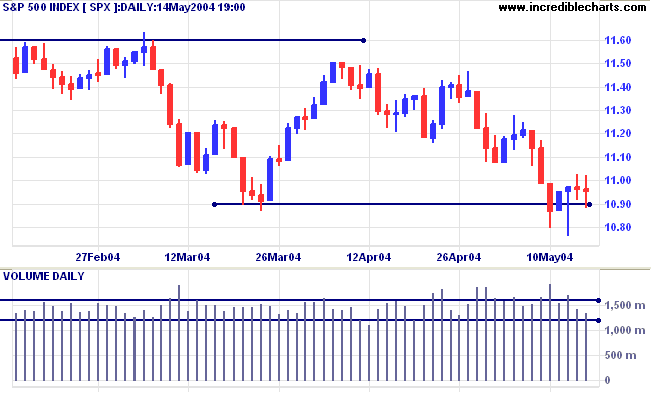
The primary trend is up, with support at 960.
Twiggs Money Flow signals weakness.
Twiggs Money Flow signals weakness.
NYSE Bullish Percent Index
The Chartcraft Bullish Percent Index has plummeted to 59.80%, on Bear Alert status.
The Chartcraft Bullish Percent Index has plummeted to 59.80%, on Bear Alert status.
Treasury yields
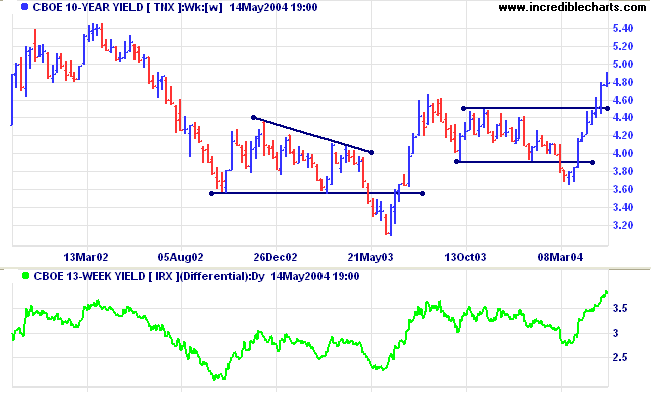
The yield on 10-year treasury notes is in a strong primary up-trend.
The yield differential (10-year T-notes minus 13-week T-bills) is at its highest level in more than 10 years; reflecting expectations that rates will be increased soon.
The yield on 10-year treasury notes is in a strong primary up-trend.
The yield differential (10-year T-notes minus 13-week T-bills) is at its highest level in more than 10 years; reflecting expectations that rates will be increased soon.
Gold
New York: Spot gold continues in a primary down-trend, closing at $376.70.
New York: Spot gold continues in a primary down-trend, closing at $376.70.
Incredible Charts - now with US
Data
|
FREE trial - Click Here
ASX Australia
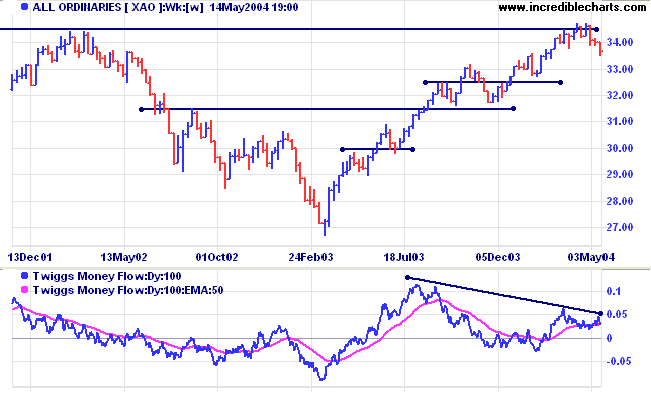
The All Ordinaries dropped sharply
through support at 3375, on Monday at [a]. This exposed buying
support at 3350 with a very weak close on strong volume at [b].
The retracement to [c] only lasted 2 days and failed to hold
above the first line of resistance, signaling a fast intermediate
down-trend.
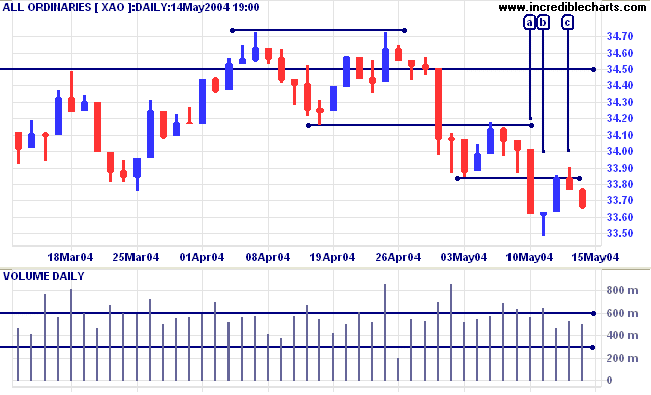
A correction that holds above 3250 will signal a
healthy primary up-trend. A fall below support at 3150 would
signal reversal.
Twiggs Money Flow displays a bearish divergence, signaling long-term weakness.
Twiggs Money Flow displays a bearish divergence, signaling long-term weakness.
Point & Figure Charts - Box sizes
There is no single setting that is suitable for all purposes. When selecting box sizes and reversal amounts, there are two main considerations :
There is no single setting that is suitable for all purposes. When selecting box sizes and reversal amounts, there are two main considerations :
-
The time
frame:
When viewing longer time frames, for intermediate or primary trends, you will need to eliminate shorter-term fluctuations. Day traders or swing traders, on the other hand, will want to see short-term rallies and corrections. -
The purpose:
Are you going to trade from the signals or merely use point and figure as a trend indicator?
We need to achieve a balance between
reliability and responsiveness:
- Large box sizes provide very reliable signals but are often late, leaving profits on the table.
| Buy/Sell Signals | |
| Buy [b]: | When a column of Xs rises above the preceding column of Xs |
| Sell [s]: | When a column of Os falls below the preceding column of Os |
- Smaller box sizes provide earlier alerts, but also deliver more false signals:
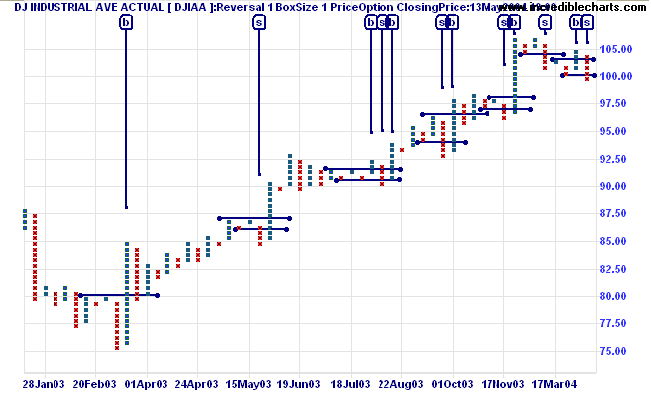
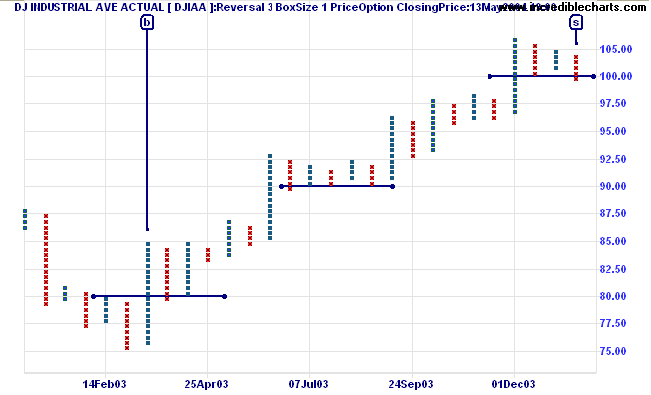
Point & Figure - Reversal Amounts
This is where reversal settings come in, enabling us to keep smaller box sizes while at the same time eliminating minor fluctuations. With reversal amounts greater than one, new columns are not started until the trend has completed a set number of boxes (normally 2 or 3).
This is where reversal settings come in, enabling us to keep smaller box sizes while at the same time eliminating minor fluctuations. With reversal amounts greater than one, new columns are not started until the trend has completed a set number of boxes (normally 2 or 3).
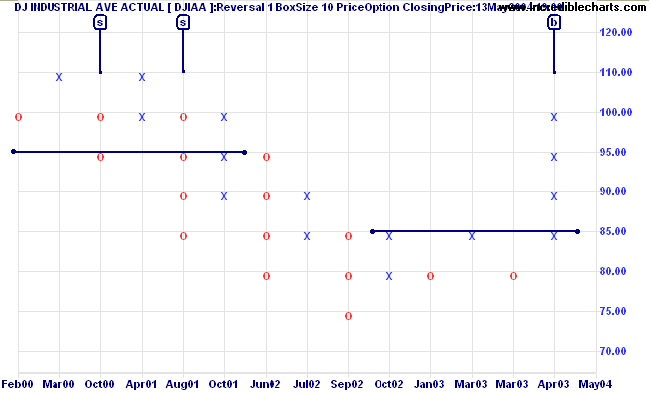
(Note where the major support/resistance levels have formed on
the above chart: at the round numbers of 8000, 9000 and 10000).
Selecting appropriate box and reversal sizes
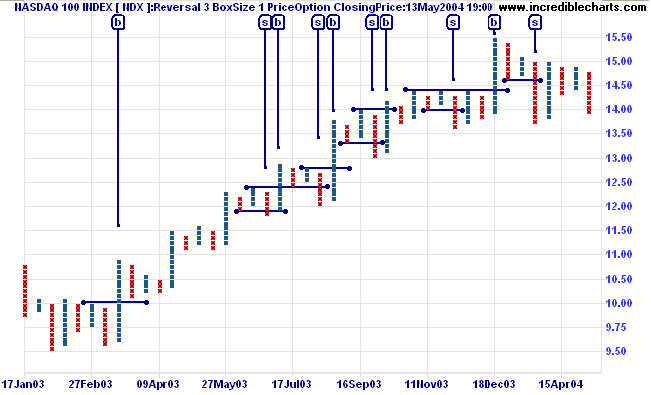
You will need to adjust box and reversal sizes for different securities (or indices): not all have the same volatility. A setting that is suitable for the Dow Jones index (above) may not be appropriate for the more volatile Nasdaq 100 [NDX]:
You will need to adjust box and reversal sizes for different securities (or indices): not all have the same volatility. A setting that is suitable for the Dow Jones index (above) may not be appropriate for the more volatile Nasdaq 100 [NDX]:
Basic principles for selecting box and reversal sizes are:
- Increase the reversal amount first, keeping the box size as small as possible (for increased responsiveness).
- The practical maximum reversal amount is about 5.
- Aim to minimize false signals, rather than to eliminate them altogether.
There are two options for manually selecting point and figure
settings:
-
Choose the best visual fit, based on chart
history.
Use the P&F selector arrow
(on the toolbar) to select saved point and figure settings.
-
Adjust box/reversal sizes according to the
Volatility
index.
Example: Use the Volatility index to derive a table for long-term trends. Set up 1000-Day Volatility index with 500-day exponential smoothing.
Stock/Index Volatility index Volatility range Number of boxes Box size Reversal amount All Ordinaries [XAO] 5.5% 5 - 10% 2 1 2 Dow Jones [DJIAA] 10% 10 - 15% 3 1 3 S&P 500 [SPX] 16% 15 - 20% 4 1 4 Nasdaq 100 [NDX] 49% 40 - 50% 10 2 5 Yahoo [YHOO] 97% 90 - 100% 20 4 5
Box sizes are increased (by 1) for each 5% increment in volatility:
The table should be used only as a guideline. It is advisable to visually inspect whether the chart is a good fit.
Next week: Point & Figure - Hi/Lo, Closing Price or Typical Price options.
Chart Tips: Chart Complete Data
History
To chart 10 years of data history (in place of 3 years):
To chart 10 years of data history (in place of 3 years):
- select Time Period >> Chart Complete Data.
About
the Trading Diary has been expanded to offer further
assistance to readers, including directions on how to search the
archives.
Colin Twiggs
We should be careful to get out of an experience
only the wisdom that is in it - and stop there;
lest we be like the cat that sits down on a hot stove-lid.
She will never sit down on a hot stove-lid again, and that is well;
but also she will never sit down on a cold one anymore.
~ Samuel Clemens.
lest we be like the cat that sits down on a hot stove-lid.
She will never sit down on a hot stove-lid again, and that is well;
but also she will never sit down on a cold one anymore.
~ Samuel Clemens.
Back Issues
Click here to access the Trading Diary Archives.
Click here to access the Trading Diary Archives.
Back Issues
Access the Trading Diary Archives.

Author: Colin Twiggs is a former investment banker with almost 40 years of experience in financial markets. He co-founded Incredible Charts and writes the popular Trading Diary and Patient Investor newsletters.
Using a top-down approach, Colin identifies key macro trends in the global economy before evaluating selected opportunities using a combination of fundamental and technical analysis.
Focusing on interest rates and financial market liquidity as primary drivers of the economic cycle, he warned of the 2008/2009 and 2020 bear markets well ahead of actual events.
He founded PVT Capital (AFSL No. 546090) in May 2023, which offers investment strategy and advice to wholesale clients.