|
Free trial expiry |
|
If your free trial expires, you will only
have access to 18-hour delayed data. Hourly updates and
7.30 p.m. final closing data are exclusive to
Premium Members. This does not apply to US data - free US updates will not be delayed until the US subscription page is available. NYSE, NASDAQ, AMEX and indices will be updated at 8.00 p.m. EST. Click Help >> About to check your membership/free trial status. |
Trading Diary
May 8, 2004
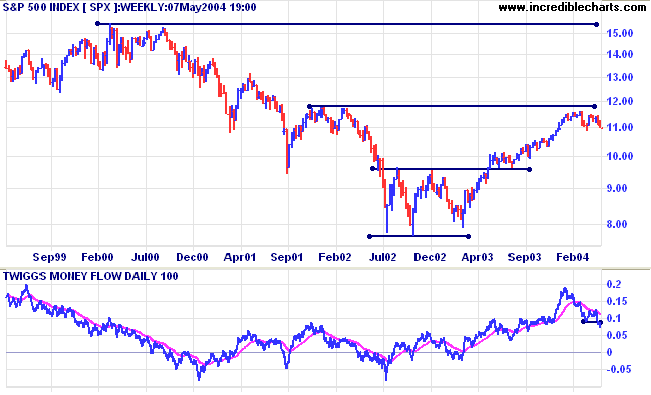
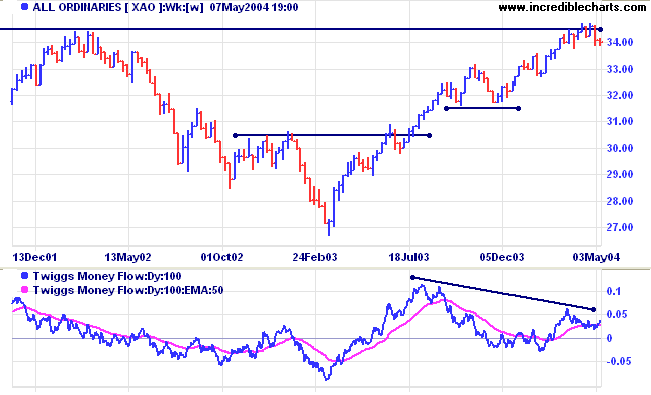
Twiggs Money Flow has fallen below its March low, signaling weakness.
The Chartcraft Bullish Percent Index is on Bear Alert status, closing below 70% at 67.54%.
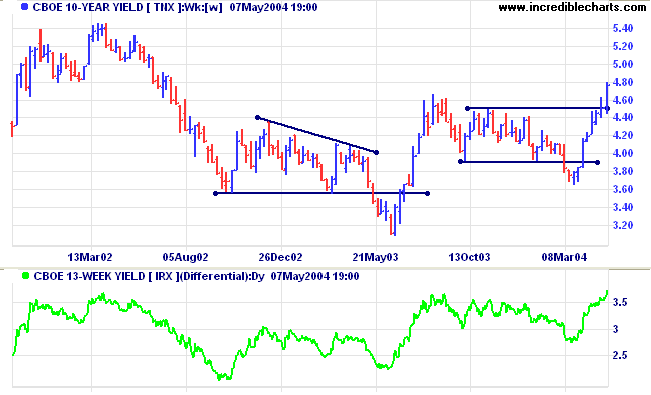
The yield on 10-year treasury notes closed up strongly at 4.766%, reflecting expectations of an increase in the Fed funds rate. The yield is in a strong primary up-trend.
The yield differential (10-year T-notes minus 13-week T-bills) has increased above 3.5%, indicating that rates increases are expected to be soon.
New York: Spot gold has fallen to $378.40, continuing the primary down-trend.
Incredible Charts - now with US
Data
|
FREE trial - Click Here
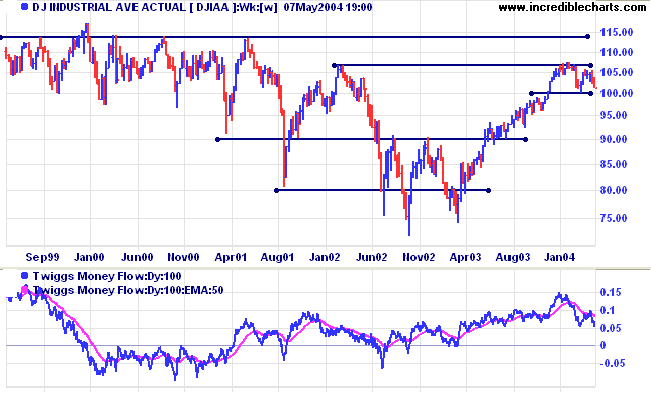
Twiggs Money Flow displays a bearish divergence, signaling long-term weakness.
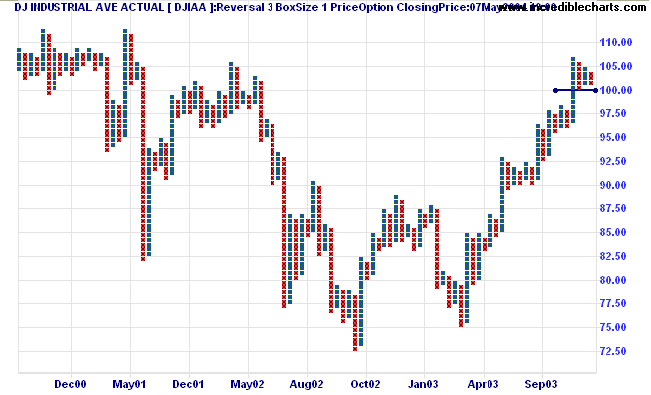
Basics are explained at the Trading Guide: Point & Figure Charts.
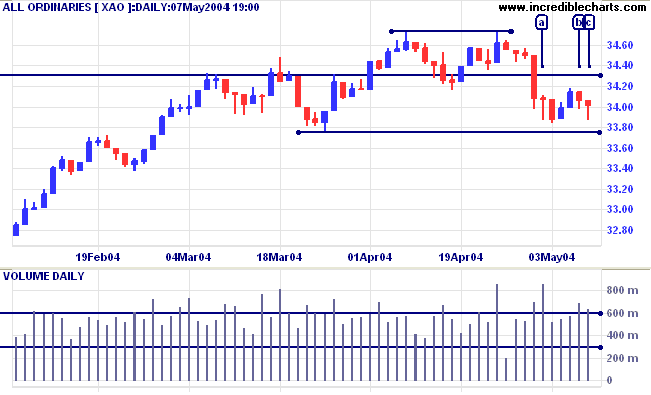
The All Ordinaries [XAO] chart below gives a clear summary of major trend movements:
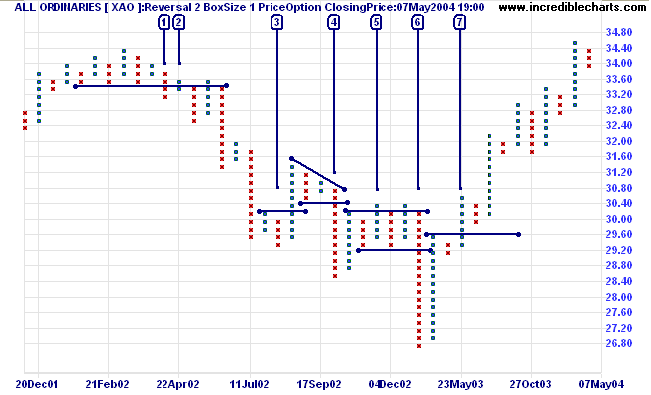
- A down-trend starts at [1], with a break below support at 3340. Note the earlier 3 upswings - all could only achieve marginal breaks above the previous highs - warning of a stage 3 top.
- Marginal breaks at [2], above the new resistance level, are a further bear signal: confirming the down-trend.
- At [3] we have a marginal break below the previous low which forewarned of a strong bear market rally.
- A bear signal with a break through support at [4].
- Marginal breaks [5] above resistance (similar to 2. above) - another bear signal.
- The break through support (2920) at [6] turns into a downward spike.
- The rise above 2960 at [7] signals the start of the current up-trend.
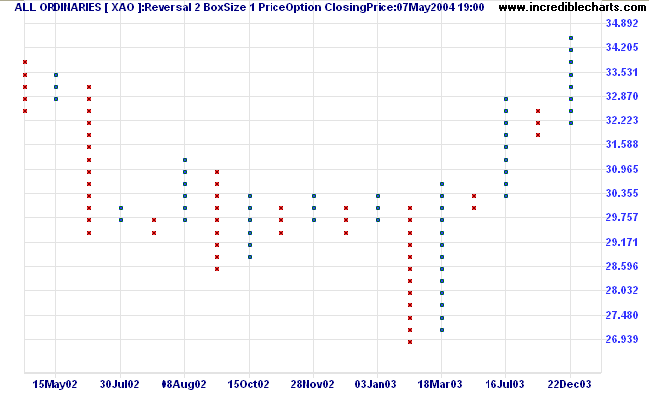
I prefer normal scale point and figure charts. While log scale charts are useful because of the graduated increase in box sizes, I find the odd-numbered box sizes a distraction. Major support and resistance levels normally occur at round numbers (especially with individual stocks rather than indices); log scales make them difficult to identify.
| Price | Box Size | |
| From: | Dollars ($) | Cents (c) |
|
$ 0.00 |
0.1 |
|
|
$ 0.20 |
0.2 |
|
|
$ 0.50 |
0.5 |
|
|
$ 1.00 |
1 |
|
|
$ 2.00 |
2 |
|
|
$ 5.00 |
5 |
|
|
$ 10.00 |
10 |
|
|
$ 20.00 |
20 |
|
|
$ 50.00 |
50 |
|
|
$ 100 |
1.00 |
100 |
|
$ 200 |
2.00 |
|
|
$ 500 |
5.00 |
|
|
$ 1000 |
10.00 |
|
Use the Indicator Panel

to set up point and figure charts. The Help Guide: Point & Figure Setup explains how.
Next week. More on Point & Figure charts:
- Box sizes and Reversal amounts
- HighLow or Closing Price method?
Another useful shortcut that users may not be aware of:
- On the Login page, after entering your password - hit the Enter key twice;
till the mud settles and the water is clear?
Can you remain unmoving
till the right action arises by itself?
- Lao Tse.
Click here to access the Trading Diary Archives.
Back Issues

Author: Colin Twiggs is a former investment banker with almost 40 years of experience in financial markets. He co-founded Incredible Charts and writes the popular Trading Diary and Patient Investor newsletters.
Using a top-down approach, Colin identifies key macro trends in the global economy before evaluating selected opportunities using a combination of fundamental and technical analysis.
Focusing on interest rates and financial market liquidity as primary drivers of the economic cycle, he warned of the 2008/2009 and 2020 bear markets well ahead of actual events.
He founded PVT Capital (AFSL No. 546090) in May 2023, which offers investment strategy and advice to wholesale clients.