|
Incredible Charts version 4.0.3.100 |
|
Your version of Incredible Charts should
automatically update when you login from tomorrow.
You may be prompted to adjust your firewall permissions to
include IP address 69.28.204.30. Changes include: >> Allowing free users access to 18-hour delayed data >> Switching advertising to a separate Linux server >> Indicator Smoothing (e.g. for Volume MAs): the maximum period has been increased from 50 to 500. Select Help >> About to check whether you have received the update. |
Trading Diary
April 24, 2004
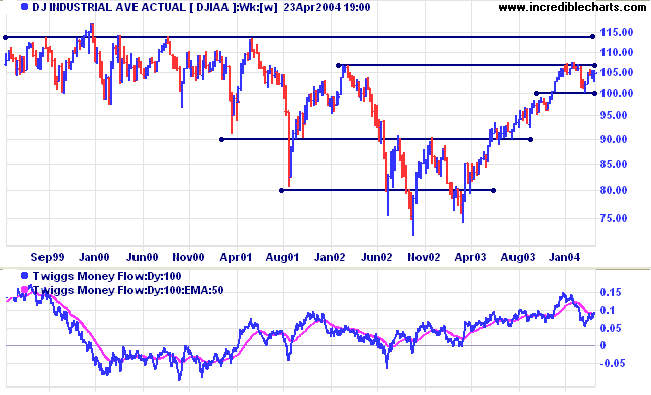
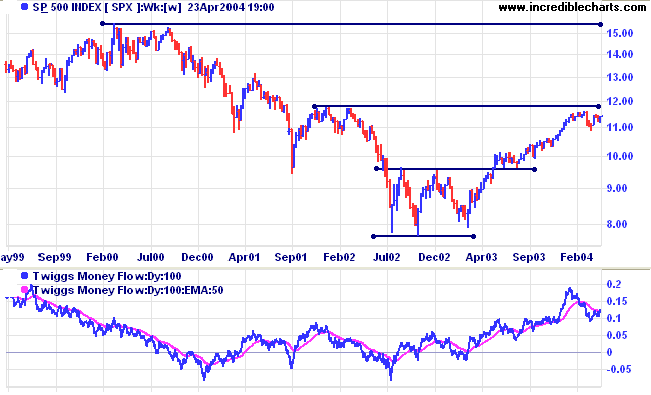
Twiggs Money Flow has crossed above its signal line but still appears weak. A fall below the March 24 low would be a strong bear signal.
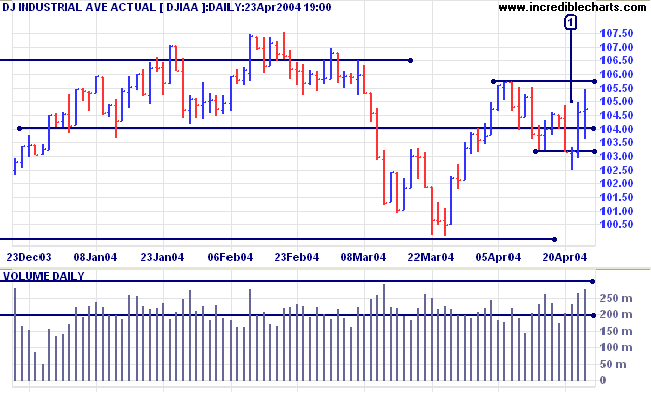
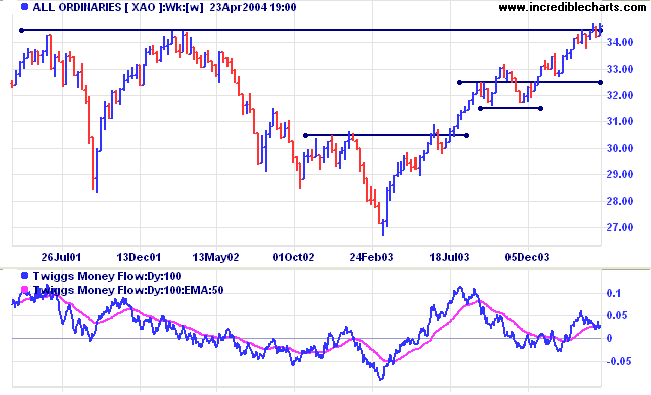
The primary trend is up. Resistance is at 2150; support at 1900.
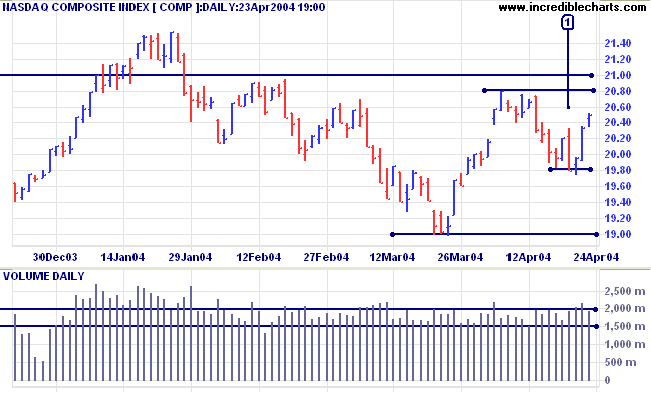
Twiggs Money Flow is rising. Reversal below the March 24 low (0.05) would be a strong bear signal.
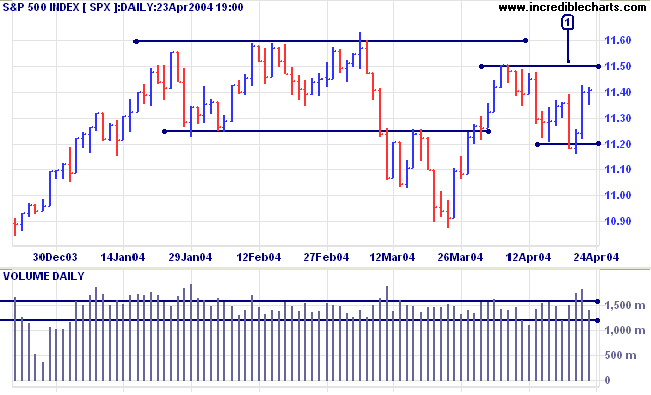
Twiggs Money Flow is weak but rising.
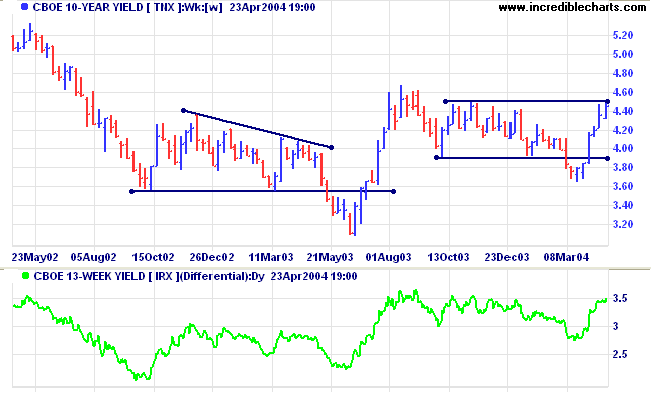
The yield on 10-year treasury notes has rallied to 4.452%.
A successful break above 4.50% would signal a primary up-trend, while a rise above 4.67% would add further confirmation.
The yield differential (10-year T-notes minus 13-week T-bills) is a healthy 3.5%; indicating that long-term investors are demanding a healthy premium for tying up their capital.
New York: Spot gold closed at $395.00 after testing support at 390.
The intermediate trend is down.
Equal lows in an up-trend are not a bear signal, but a fall below $390 would signal reversal of the primary up-trend.
Incredible Charts - now with US
Data
|
FREE trial - Click Here
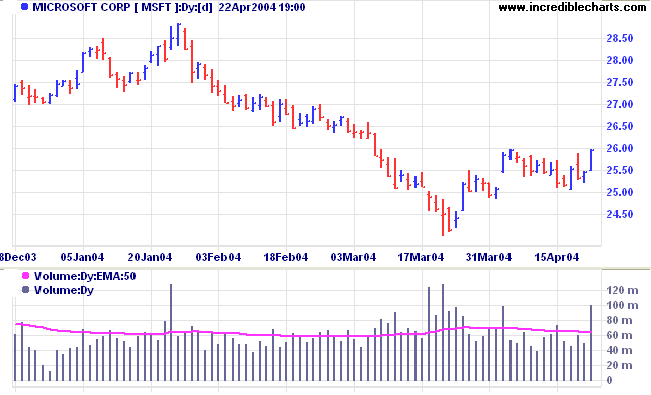
The intermediate trend is up.
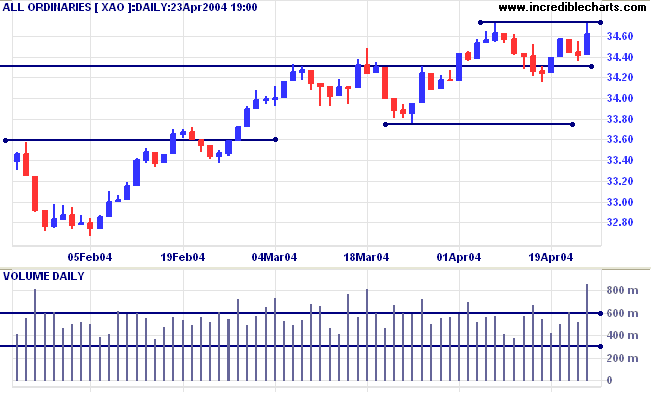
Twiggs Money Flow may be forming a bearish divergence, which would signal long-term weakness.
Volume Moving Averages help to identify unusual volume activity, like the volume spikes prior to the last two Microsoft reversals:
-
open the Indicator Panel

- select Volume in the left column (or the right column if you want to edit the existing selection)
- in the center panel, select Daily at the top
- under Optional Indicator Smoothing, select an MA type (Exponential, Simple or Weighted) and enter a time period (e.g. 50)
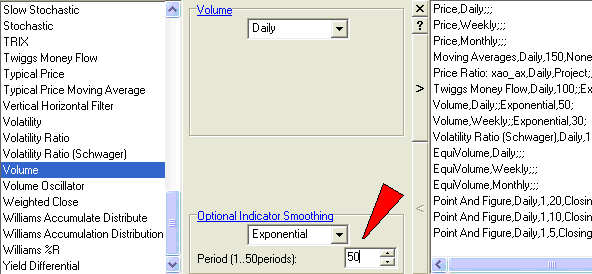
- save the new settings [>] and close the Indicator Panel [x].
The Indicator Panel
offers 3 separate help links (indicated by blue pointers):
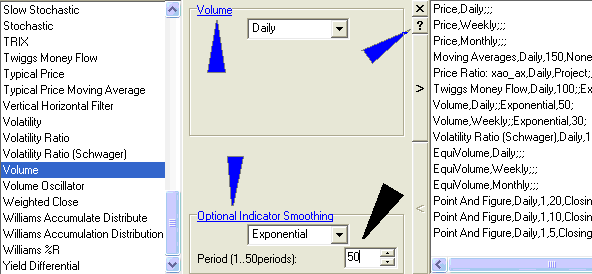
- A selected indicator ( e.g. Volume) is linked to a Trading Guide which explains how the indicator is constructed, suggests suitable trading strategies, and offers practical examples.
- [?] links to the Indicator Help page which shows how to add Indicators
- Optional Indicator Smoothing explains how to add a moving average/signal line to an indicator.
We have noticed a new email virus with the subject line: "Notify about your email account utilization".
The email warns that your email account may be infected by a proxy-related trojan server and suggests that you open an attached zip file for further information. Never open file attachments without first checking with the sender.
and money is made by discounting the obvious
and betting on the unexpected.
~ George Soros .
Click here to access the Trading Diary Archives.
Back Issues

Author: Colin Twiggs is a former investment banker with almost 40 years of experience in financial markets. He co-founded Incredible Charts and writes the popular Trading Diary and Patient Investor newsletters.
Using a top-down approach, Colin identifies key macro trends in the global economy before evaluating selected opportunities using a combination of fundamental and technical analysis.
Focusing on interest rates and financial market liquidity as primary drivers of the economic cycle, he warned of the 2008/2009 and 2020 bear markets well ahead of actual events.
He founded PVT Capital (AFSL No. 546090) in May 2023, which offers investment strategy and advice to wholesale clients.