
|
|
E*TRADE - New Conditional Orders
help you stop losses and also seize profits. Protecting your portfolio against market dips is only half the story. There's a market full of opportunities out there, too. Which is why we've created Conditional Orders. To learn more, click here. |
Trading Diary
April 17, 2004
These extracts from my daily trading diary
are for educational purposes
and should not be interpreted as investment
advice. Full terms and conditions can be found at Terms
of Use.
USA
The Dow Industrial Average is in an intermediate
up-trend. The up-turn above 10330 is signals reasonable
trend strength. The recent high of 10570 now becomes important: a
double top, completed by a fall below 10330 would be a strong
bear signal, indicating the failure to test previous highs.
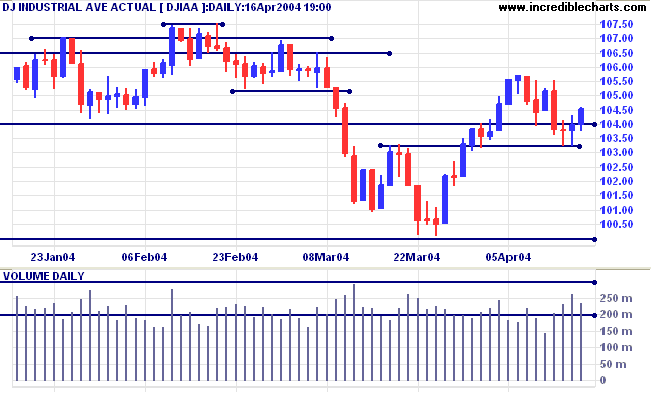
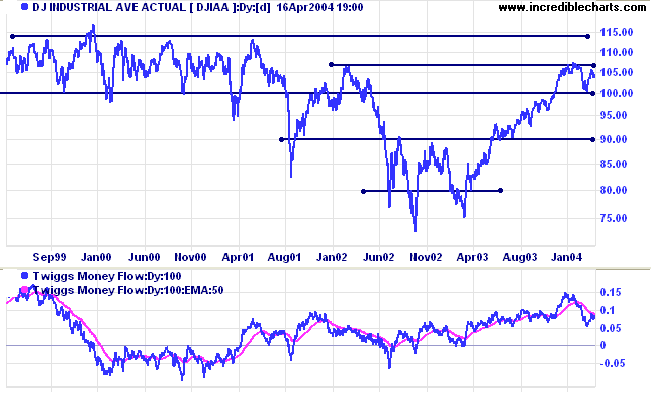
A break above resistance at 10700 to 10750, however, would signal
resumption of the primary up-trend, and a likely test of
resistance at 11400. Support is at 10000.
Twiggs Money Flow signals trend weakness.
Twiggs Money Flow signals trend weakness.
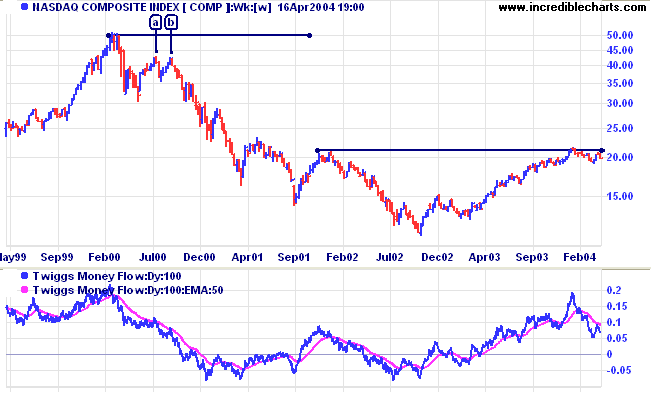
The Nasdaq Composite faces similar resistance at 2100. A
double top pattern below the recent high would be a strong bear
signal. A previous double top, at [a] and [b], is an excellent
example of the bearish pattern.
A rise above 2150 would signal resumption of the primary up-trend. Support is at 1900.
Twiggs Money Flow signals trend weakness, with recent peaks below the signal line.
A rise above 2150 would signal resumption of the primary up-trend. Support is at 1900.
Twiggs Money Flow signals trend weakness, with recent peaks below the signal line.
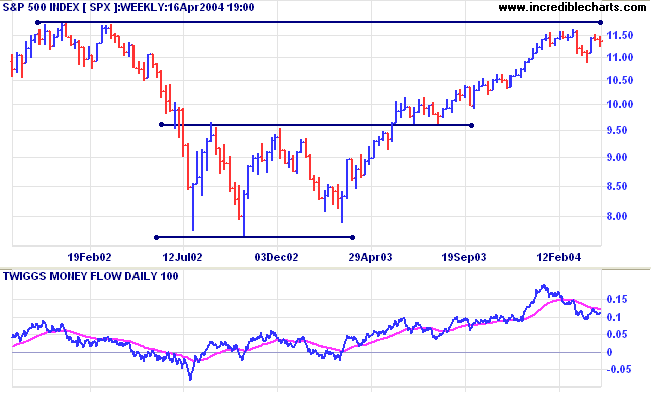
The S&P 500 faces a similar pattern, with resistance
at 1150 and support at 1120.
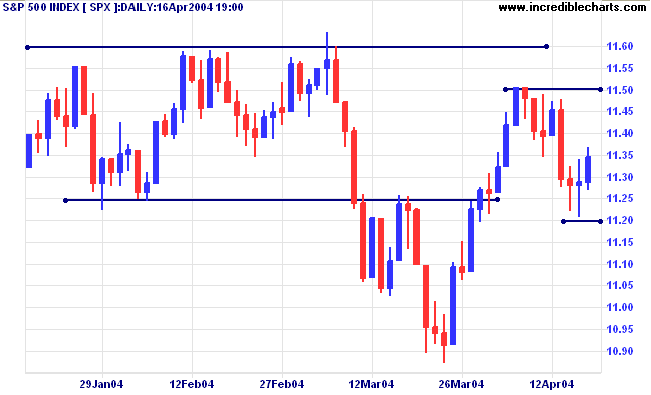
A fall below 1087 would signal primary trend
reversal.
Twiggs Money Flow is bearish, with recent peaks below the signal line.
Twiggs Money Flow is bearish, with recent peaks below the signal line.
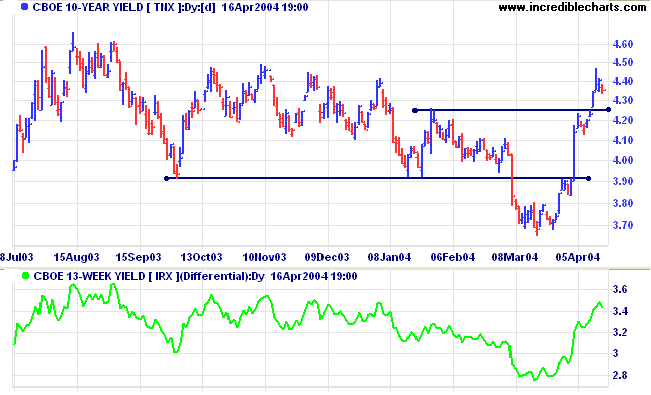
Treasury yields
The yield on 10-year treasury notes closed up at 4.352%.
The primary trend is still uncertain.
The yield differential (10-year T-notes minus 13-week T-bills) is above 3.4%, indicating that long-term investors are demanding a healthy premium for tying up their capital.
The yield on 10-year treasury notes closed up at 4.352%.
The primary trend is still uncertain.
The yield differential (10-year T-notes minus 13-week T-bills) is above 3.4%, indicating that long-term investors are demanding a healthy premium for tying up their capital.
Gold
New York: Spot gold retreated sharply to close at $400.20.
The intermediate trend is down.
A fall below $390 would signal reversal of the primary trend.
New York: Spot gold retreated sharply to close at $400.20.
The intermediate trend is down.
A fall below $390 would signal reversal of the primary trend.
Incredible Charts - now with US
Data
|
FREE trial - Click Here
ASX Australia
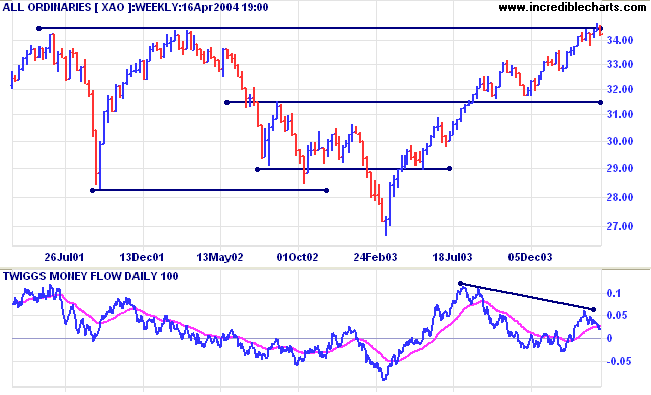
The All Ordinaries pull-back did not respect
support at 3425 to 3450, signaling possible weakness.
The intermediate trend is still up.
The intermediate trend is still up.
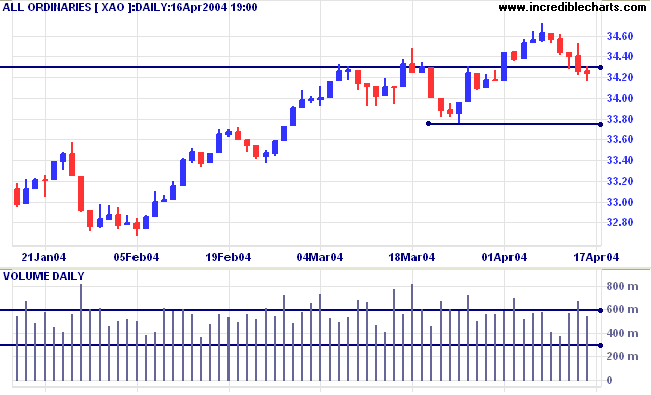
The primary trend is up.
Twiggs Money Flow appears to be forming a bearish divergence, which would signal long-term weakness.
Twiggs Money Flow appears to be forming a bearish divergence, which would signal long-term weakness.
Treasury Yields and Interest Rates
Rising yields normally signal that the economy is recovering in the short to medium term, due to:
Rising yields normally signal that the economy is recovering in the short to medium term, due to:
- increased demand for corporate debt, to finance inventories and new investment; and
- investors switching out of bonds and into equities.
The Yield Differential
The Federal Reserve drives up short-term interest rates, when it decides that the economy is overheating, and lowers short-term rates when it wants to stimulate the economy. The Fed's actions may affect the normal difference between long and short-term yields: the premium that long-term bond investors normally demand to compensate them for tying up their capital for long periods. In severe cases, when the Fed has to hit the brakes hard, short-term yields may rise to the point where they exceed long-term yields; creating a negative yield differential. This does not occur very often but, when it does, equity markets can expect a significant down-turn within the next 12 months.
The Federal Reserve drives up short-term interest rates, when it decides that the economy is overheating, and lowers short-term rates when it wants to stimulate the economy. The Fed's actions may affect the normal difference between long and short-term yields: the premium that long-term bond investors normally demand to compensate them for tying up their capital for long periods. In severe cases, when the Fed has to hit the brakes hard, short-term yields may rise to the point where they exceed long-term yields; creating a negative yield differential. This does not occur very often but, when it does, equity markets can expect a significant down-turn within the next 12 months.
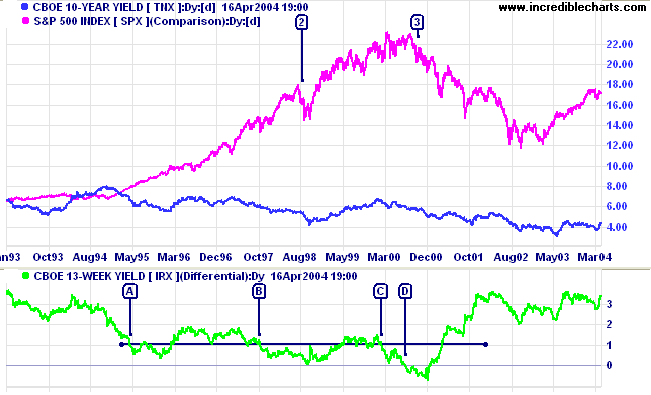
The above chart compares the yield differential
(between 10-year treasury notes and 13-week T-bills) to the
S&P 500. There are 3 periods where the yield differential has
dropped below 1.0% and one [D] where the yield differential was
negative:
- [A] was a no-show, with little change in the upward trend of the SPX apart from a consolidation in mid-1996;
- [B] was followed by a sharp correction in August/September 1998;
- [C] was the most severe, with a fall below zero at [D] and a major fall in the SPX over the next 12 months.
Setting Up The Yield Differential
Indicator
- Chart the CBOE 10 Year Yield (TNX) - under Indexes: CBOE on the Securities menu
-
Select the

Indicator Panel on the toolbar -
Select Price
Differential in the left column
A pop-up menu appears of all listed securities exchanges - Browse the drop-down menu and select CBOE 13 Week Yield (IRX) under Indexes: CBOE
- Select Daily and Apply to Security in the center panel
- Save the settings [ >] and close the indicator panel [X]
About
the Trading Diary has been expanded to offer further
assistance to readers, including directions on how to search the
archives.
Colin Twiggs
To study and not think is a waste.
To think and not study is dangerous.
~ The Analects of Confucius.
To think and not study is dangerous.
~ The Analects of Confucius.
Back Issues
Click here to access the Trading Diary Archives.
Click here to access the Trading Diary Archives.
Back Issues
Access the Trading Diary Archives.

Author: Colin Twiggs is a former investment banker with almost 40 years of experience in financial markets. He co-founded Incredible Charts and writes the popular Trading Diary and Patient Investor newsletters.
Using a top-down approach, Colin identifies key macro trends in the global economy before evaluating selected opportunities using a combination of fundamental and technical analysis.
Focusing on interest rates and financial market liquidity as primary drivers of the economic cycle, he warned of the 2008/2009 and 2020 bear markets well ahead of actual events.
He founded PVT Capital (AFSL No. 546090) in May 2023, which offers investment strategy and advice to wholesale clients.