
|
TWO WEEK FREE TRIAL – MARCH ONLY INVESTMENT WISE NEWSLETTER Are you picking outperforming stocks? Investment Wise is fast gaining a reputation for picking ‘outperforming’ stocks, or the ‘blue chips’ of tomorrow TODAY. It is one of Australia’s fastest growing investment advisory firms that provides independent advice about ASX stocks. Access your free trial today – click here |
Trading Diary
March 27, 2004
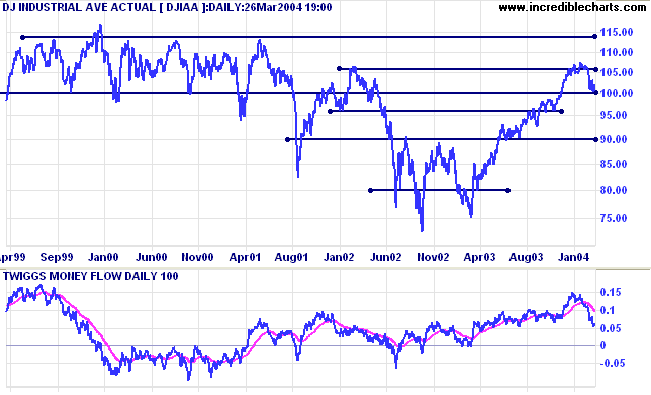
Twiggs Money Flow has fallen to a 6-month low; a bearish sign.
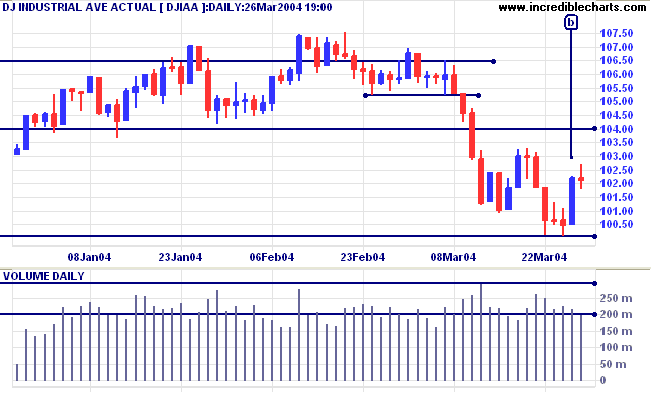
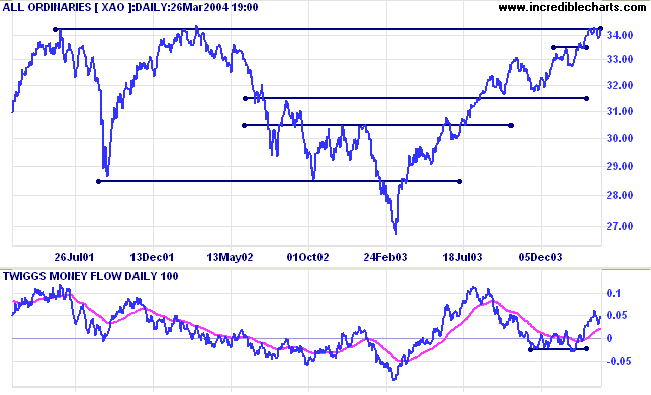
Failure to penetrate 2000 will be bearish, signaling continuation of the intermediate down-trend.
The primary trend is up. Initial support is at 1750 to 1780.
Twiggs Money Flow is bearish, having fallen to a 6-month low.
Twiggs Money Flow is falling sharply.
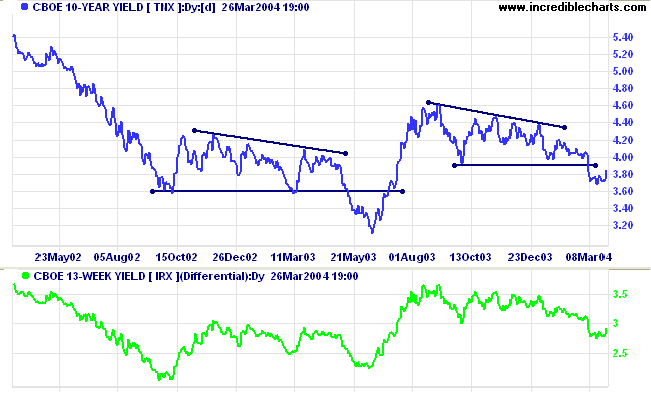
The yield on 10-year treasury notes rallied to 3.84%.
The intermediate trend is down.
The primary trend is down.
New York: Spot gold has rallied strongly to finish the week at $422.10.
The intermediate trend is up.
The primary trend is up. A fall below $370 would signal reversal.
Incredible Charts - now with US
Data
|
FREE trial - Click Here
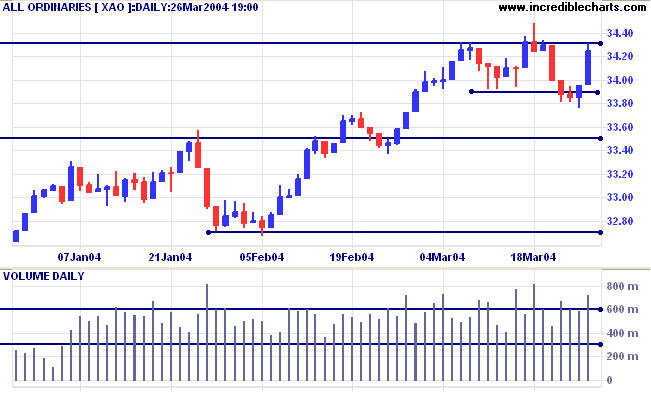
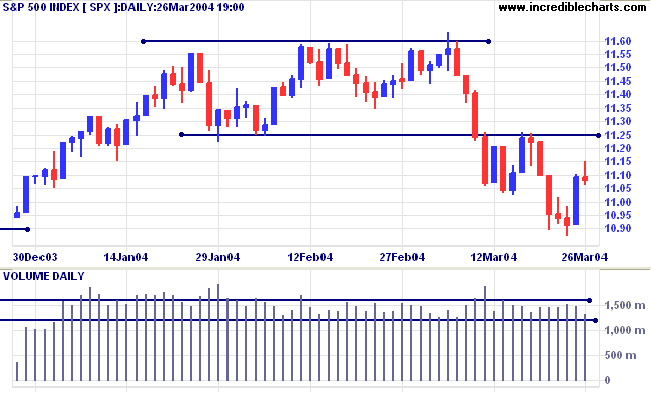
The primary trend is up. Resistance is at 3440 to 3450; support is at 3160.
Twiggs Money Flow signals accumulation (intermediate time frame).
On Sunday night, March 28, the ASX switches back to normal AEST (GMT +10), from daylight saving time (GMT + 11).
ASX opening and closing times will, therefore, be one hour later in Queensland, NT and WA.
Victoria, ACT, NSW, SA and Tasmania will also enjoy US markets closing one hour earlier.
For further details, see Coping with different Time Zones.
Incredible Charts Premium
version
|
FREE trial - Click Here
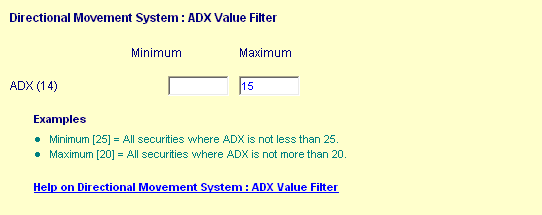
The ADX line in Welles Wilder's Directional Movement system indicates the level of trend movement. Low readings will identify stocks in a ranging (or consolidation) pattern.
-
Open the Stock Screen module from the
toolbar

- Select Directional Movement System
- Scroll down to ADX Value Filter
- Enter 15 (or 20) as the Maximum
- Submit
The two stocks with the lowest ADX readings in the S&P 500 are:
- Advanced Micro devices [AMD] - 7.4
- Citigroup [C] - 9.5
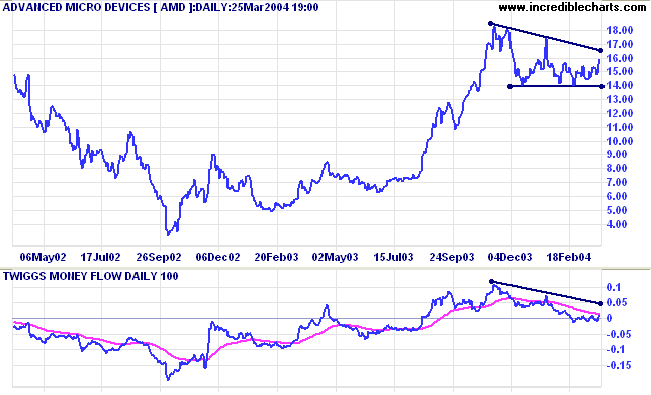
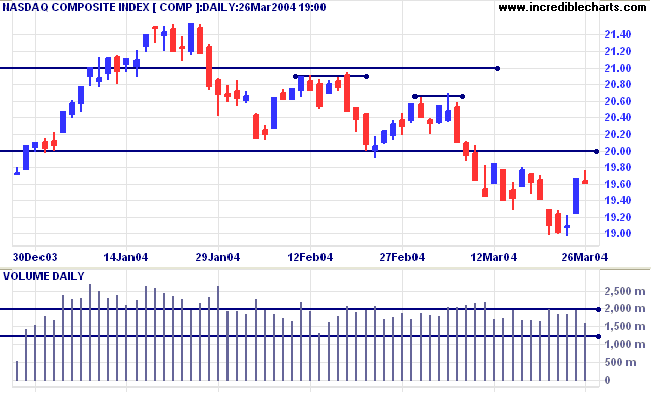
Twiggs Money Flow has fallen to a 6-month low, signaling distribution.
For Australian stocks, the lowest readings are:
- Austereo [AEO] - 10.2
- Billabong [BBG] - 11.0
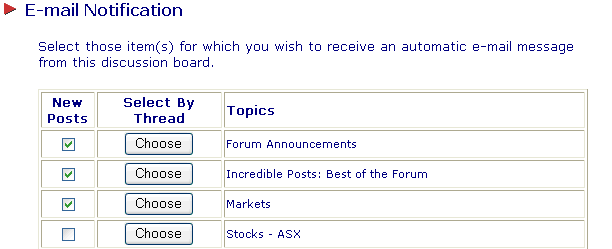
- Go to the Chart Forum.
- Login to your Profile in the Forum menu bar.
- Select Email Notications.
- Check the box in the New Posts column to select the desired Topic (see below).
- Click the Save Profile Changes button.
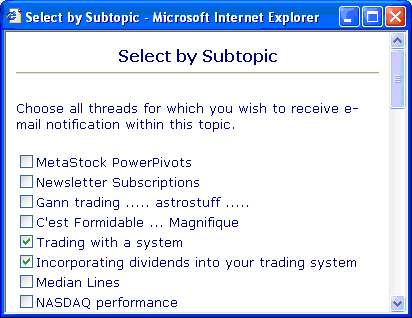
- Repeat steps 1. to 3. above
- Click the Choose button next to the Topic.
- Select the thread from the pop-up list (see below).
- Click the Save button; then Save Profile Changes.
for the simple reason that without such structuring of complex systems into sub-assemblies,
there could be no order and stability......
~ Arthur Koestler.
Click here to access the Trading Diary Archives.
Back Issues

Author: Colin Twiggs is a former investment banker with almost 40 years of experience in financial markets. He co-founded Incredible Charts and writes the popular Trading Diary and Patient Investor newsletters.
Using a top-down approach, Colin identifies key macro trends in the global economy before evaluating selected opportunities using a combination of fundamental and technical analysis.
Focusing on interest rates and financial market liquidity as primary drivers of the economic cycle, he warned of the 2008/2009 and 2020 bear markets well ahead of actual events.
He founded PVT Capital (AFSL No. 546090) in May 2023, which offers investment strategy and advice to wholesale clients.