
|
TWO WEEK FREE TRIAL – MARCH ONLY INVESTMENT WISE NEWSLETTER Are you picking outperforming stocks? Investment Wise is fast gaining a reputation for picking ‘outperforming’ stocks, or the ‘blue chips’ of tomorrow TODAY. It is one of Australia’s fastest growing investment advisory firms that provides independent advice about ASX stocks. Access your free trial today – click here |
Trading Diary
March 20, 2004
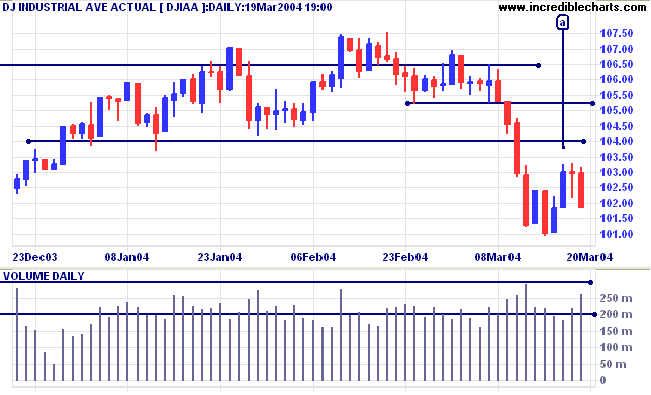
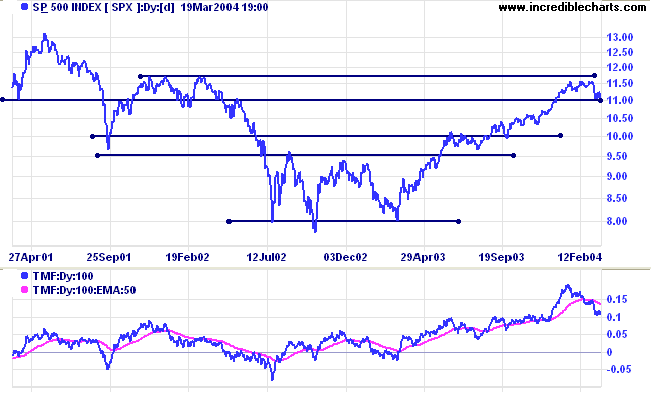
Twiggs Money Flow displays a secondary signal, having broken below its signal line.
The primary trend is up. Initial support is at 1750 to 1780.
The intermediate trend is down.
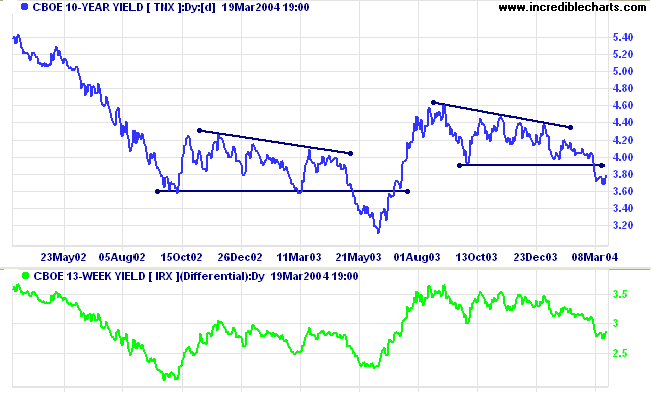
The yield on 10-year treasury notes has consolidated below the previous support level, closing the week at 3.788%.
The intermediate trend is down.
The primary trend is down.
New York: Spot gold has rallied strongly to $412.10.
The intermediate trend has turned upwards, with a higher low followed by a higher high (above 405).
The primary trend is up. A fall below $370 would signal reversal.
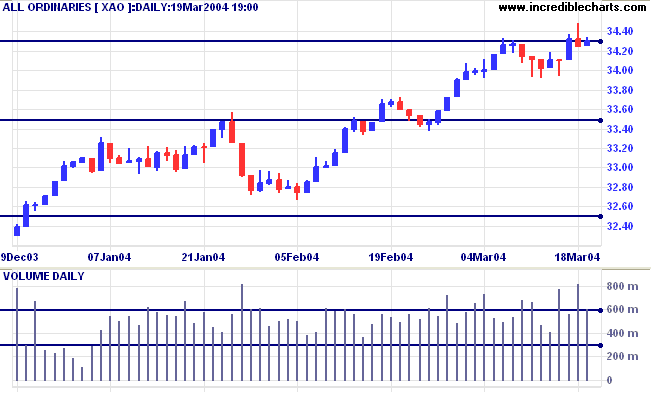
The primary trend is up. Resistance is at 3440 to 3450; support is at 3160.
Bollinger Bands can be used to screen for trending or ranging stocks, depending on the settings. To screen for stocks in an up-trend:
-
Open the Stock Screen module from the
toolbar

- Select Bollinger Bands: 1 Standard Deviation
- Enter 100 as the 100-Day Minimum
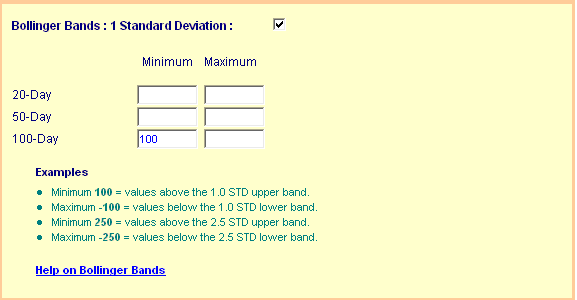
For shorter time frames, insert the Minimum in the 50-Day or 20-Day fields.
To identify consistent trends, insert a value as the Minimum for all three fields. Be wary, however, of stocks that are in extended up-trends. They may not present the best opportunities.
To screen for stocks in a down-trend:
- Enter 100 as the 100-Day Maximum.
To screen for stocks in a trading range:
- Enter -30 as the 20-Day, 50-Day and 100-Day Minimum
- Enter 30 as the 20-Day, 50-Day and 100-Day Maximum

Incredible Charts Premium
version
|
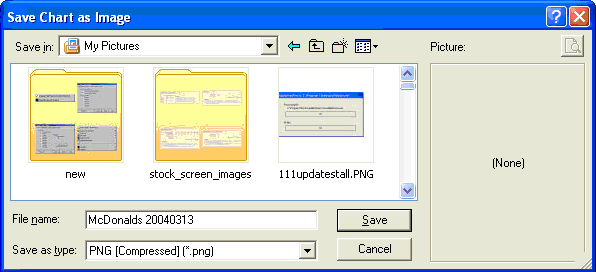
- Select File >> Save Chart As Image.
- Leave the chart size as the default 651 x 395 pixels
-
Select a folder to save the chart
in.
The path to the Charts folder in Incredible Charts is
C:\Program Files\Incredible Charts\{yourname}\{username+emailaddress}
or C:\Program Files\Incredible Charts\Default\{username+emailaddress} for newer members. - Alternatively, save the image to the My Documents\My Pictures folder.
- Save the chart as a PNG file.
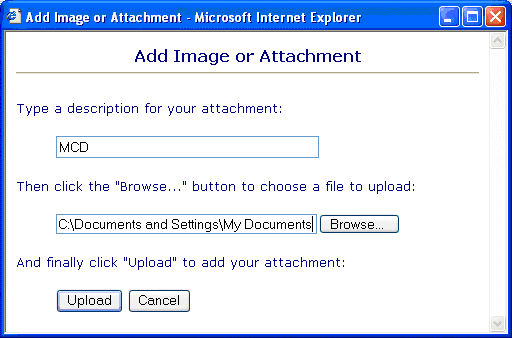
- Insert a short name for the chart (Eg. "MCD")
- Use the Browse button to locate the chart file (e.g. "mcd_ax09Apr02_to_13Feb03.PNG")
- Click the Upload button to upload the image.
- Cut and paste the image anywhere within your post.
~ Chuck Carlson.
Click here to access the Trading Diary Archives.
Back Issues

Author: Colin Twiggs is a former investment banker with almost 40 years of experience in financial markets. He co-founded Incredible Charts and writes the popular Trading Diary and Patient Investor newsletters.
Using a top-down approach, Colin identifies key macro trends in the global economy before evaluating selected opportunities using a combination of fundamental and technical analysis.
Focusing on interest rates and financial market liquidity as primary drivers of the economic cycle, he warned of the 2008/2009 and 2020 bear markets well ahead of actual events.
He founded PVT Capital (AFSL No. 546090) in May 2023, which offers investment strategy and advice to wholesale clients.