Incredible Charts Premium
version
|
Trading Diary
March 13, 2004
These extracts from my daily trading diary
are for educational purposes
and should not be interpreted as investment
advice. Full terms and conditions can be found at Terms
of Use.
USA
After a sharp fall through support at 10400 the Dow Industrial
Average has consolidated with an inside day on lower
volume.
The intermediate trend is down. Expect a test of support at 10000.
The intermediate trend is down. Expect a test of support at 10000.
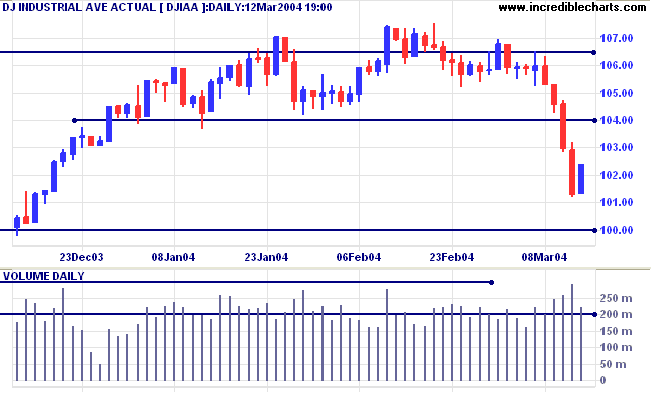
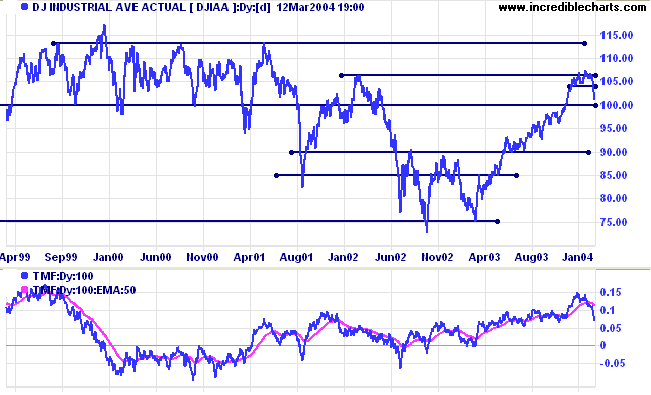
The primary trend is up. The current fall is merely a secondary
reaction. Performance of the subsequent recovery will indicate
the strength of the primary trend. Expect strong resistance from
11300 to 11500 (highs established in 1999 to 2001). Support is at
10000 and 9000.
Twiggs Money Flow gives a secondary signal, having broken below its signal line.
Twiggs Money Flow gives a secondary signal, having broken below its signal line.
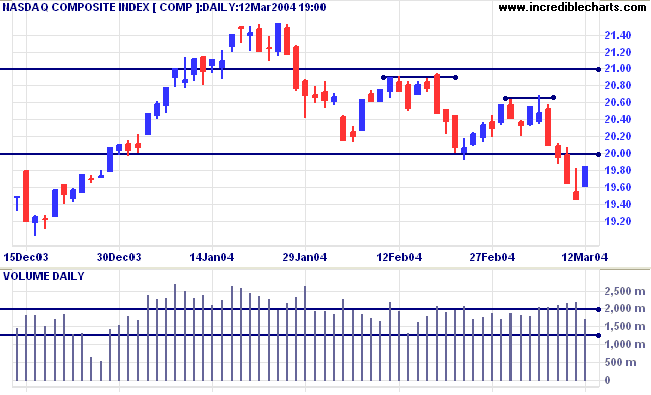
The Nasdaq Composite is creeping lower in an intermediate
down-trend. Volume is stronger on the down-swings but there are
significant overlaps between peaks and troughs, indicating a lack
of urgency. Failure to penetrate resistance at 2000 will signal
that the trend is accelerating.
The primary trend is up. Initial support is at 1750.
The primary trend is up. Initial support is at 1750.
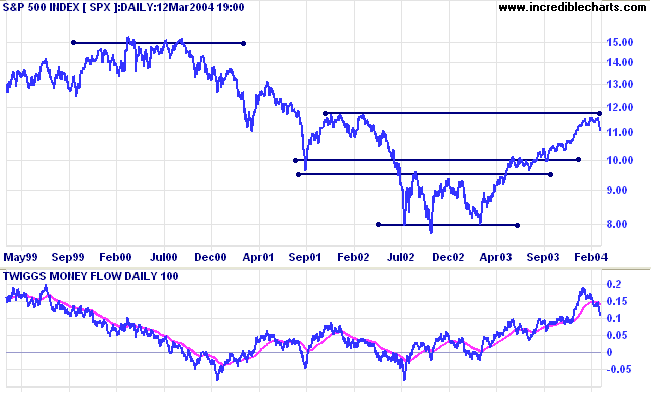
The S&P 500 fell sharply during the week, after a false break
above resistance the previous Friday. Strong volume was evident
on the down-swing, before declining on Friday's inside
day.
The intermediate trend has turned down. Failure to cross back above resistance at 1120 would be a bearish signal.
The intermediate trend has turned down. Failure to cross back above resistance at 1120 would be a bearish signal.
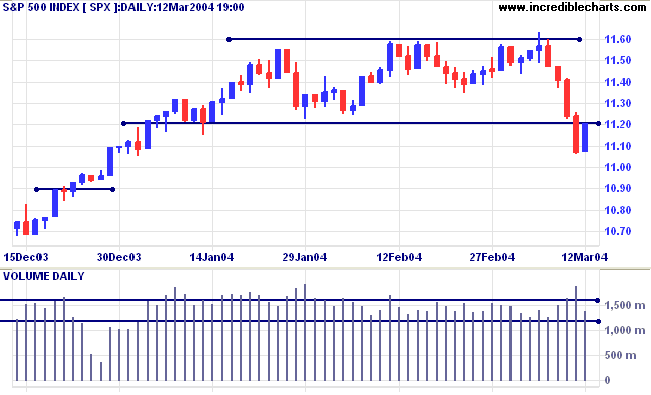
The primary trend is up. Support is at 1100 and 1000; resistance
at 1170 to 1200.
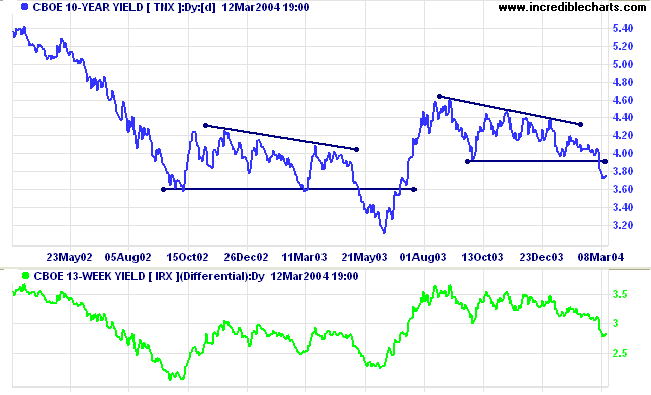
Treasury yields
The yield on 10-year treasury notes consolidated at 3.76% after falling sharply through support at 3.93%.
The intermediate trend is down.
The primary trend is down, after the breakout from the bearish descending triangle.
The yield on 10-year treasury notes consolidated at 3.76% after falling sharply through support at 3.93%.
The intermediate trend is down.
The primary trend is down, after the breakout from the bearish descending triangle.
The
yield differential (10-year T-notes minus 13-week T-bills) is
down at 2.8%; still reasonably healthy.
Gold
New York: Spot gold is back down at $395.00.
The intermediate trend is down.
The primary trend is up. A fall below $370 would signal reversal.
New York: Spot gold is back down at $395.00.
The intermediate trend is down.
The primary trend is up. A fall below $370 would signal reversal.
ASX Australia
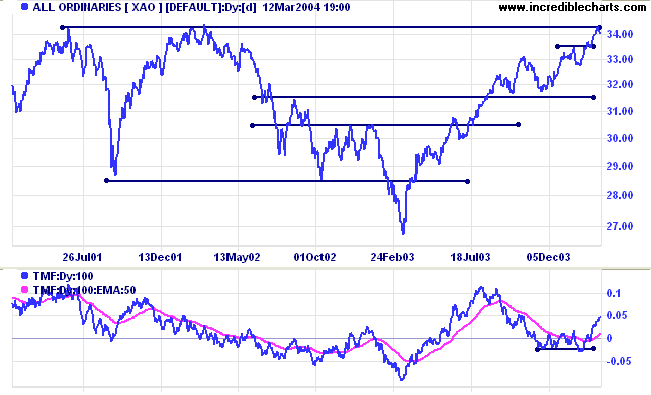
The All Ordinaries has retraced to 3402. The
weak close and lower volume signals an absence of selling
pressure. Expect another test of resistance at 3430.
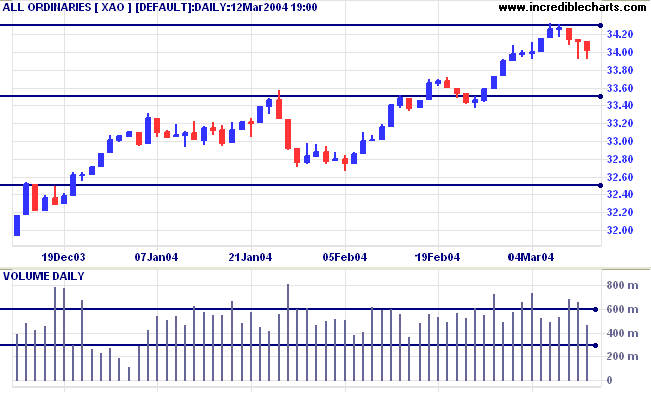
The intermediate trend is up.
The primary trend is up. RTrading Diary
The primary trend is up. R
Trading Diary
esistance is at
3450, the high from 2002
Australian sectors
We have had to curtail our coverage of sectors to ensure compliance with Australian Financial Services Regulations. The new weekly format will include coverage of stock screens, indicators, chart patterns, support and resistance and other items of general interest to subscribers.
We have had to curtail our coverage of sectors to ensure compliance with Australian Financial Services Regulations. The new weekly format will include coverage of stock screens, indicators, chart patterns, support and resistance and other items of general interest to subscribers.
Stock Screening - Relative
Strength
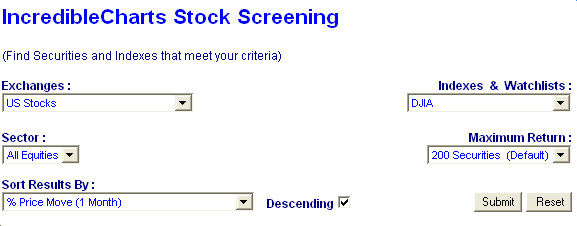
To determine the relative performance of stocks (or indices) over a set time period, sort your stock screen by %Price Move. For example, to determine the relative strength (over 1 month) of stocks in the Dow Jones Industrial Average:
To determine the relative performance of stocks (or indices) over a set time period, sort your stock screen by %Price Move. For example, to determine the relative strength (over 1 month) of stocks in the Dow Jones Industrial Average:
- Open the Stock Screen module from the toolbar

- Select US Stocks (under Exchanges)
- Select DJIA (under Indexes & Watchlists)
- Sort Results By % Price Move (1 Month)
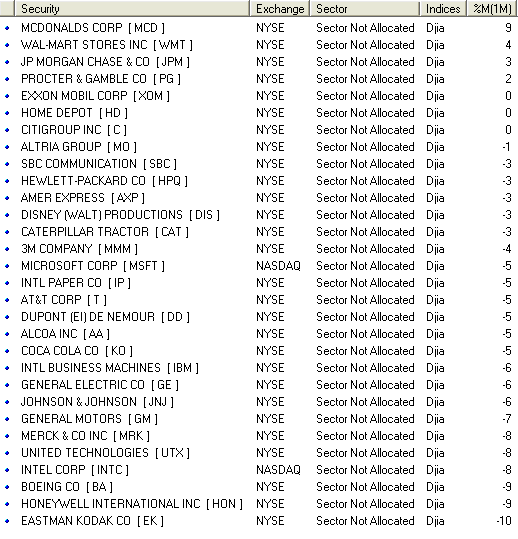
The results will be displayed in order of performance:
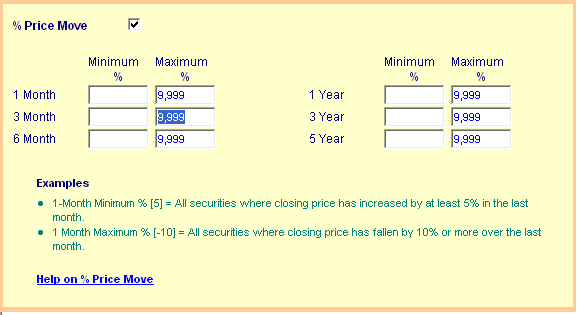
If you want to screen for Relative Strength over more than one
time frame:
- Open the % Price Move filter and add 99999 as the Maximum for each of the required time periods.
To order results for a specific time period, click the header
{e.g. %M(1M)} above the required column on the return.
Incredible Charts Premium
version
|
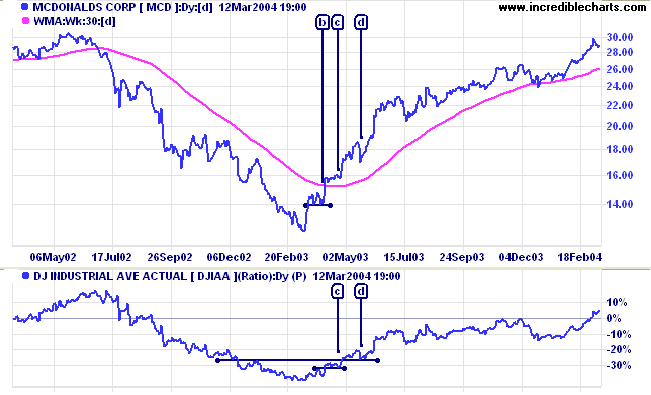
McDonalds was the Dow's top performer over 1 month. You can see
from the Relative Strength chart that MCD has been strengthening
since April 2003 when it crossed above its 30-week weighted
moving average.
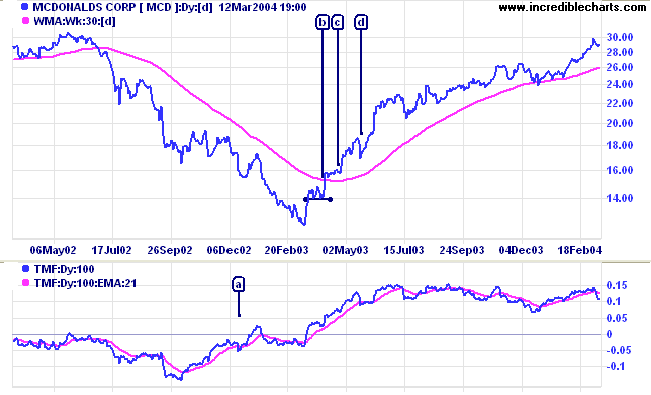
Equal higher lows at [b], confirming support at 14.00 above the March low of 12.00, gave the first bull signal.
This was followed by a consolidation above the 30-week MA at [c], with Relative Strength (price ratio: djia) respecting the previous 1-month RS high - a strong bull signal.
The final confirmation, for the most conservative traders, comes with RS respecting the previous 3-month high at [d].
Twiggs Money Flow had been rising since December at [a] and
signaled healthy accumulation by the time of the first signal at
[b].
About
the Trading Diary has been expanded to offer further
assistance to readers, including directions on how to search the
archives.
Colin Twiggs
There is no security in this life.
There is only opportunity.
~ General Douglas MacArthur.
There is only opportunity.
~ General Douglas MacArthur.
Back Issues
Click here to access the Trading Diary Archives.
Click here to access the Trading Diary Archives.
Back Issues
Access the Trading Diary Archives.

Author: Colin Twiggs is a former investment banker with almost 40 years of experience in financial markets. He co-founded Incredible Charts and writes the popular Trading Diary and Patient Investor newsletters.
Using a top-down approach, Colin identifies key macro trends in the global economy before evaluating selected opportunities using a combination of fundamental and technical analysis.
Focusing on interest rates and financial market liquidity as primary drivers of the economic cycle, he warned of the 2008/2009 and 2020 bear markets well ahead of actual events.
He founded PVT Capital (AFSL No. 546090) in May 2023, which offers investment strategy and advice to wholesale clients.