Incredible Charts Premium
version
|
Trading Diary
March 6, 2004
These extracts from my daily trading diary
are for educational purposes
and should not be interpreted as investment
advice. Full terms and conditions can be found at Terms
of Use.
USA
The Dow Industrial Average is consolidating around the 10600
level.
The intermediate trend is uncertain. A fall below support at 10400 would signal reversal to a down-trend, favoring a re-test of support at 10000.
The intermediate trend is uncertain. A fall below support at 10400 would signal reversal to a down-trend, favoring a re-test of support at 10000.
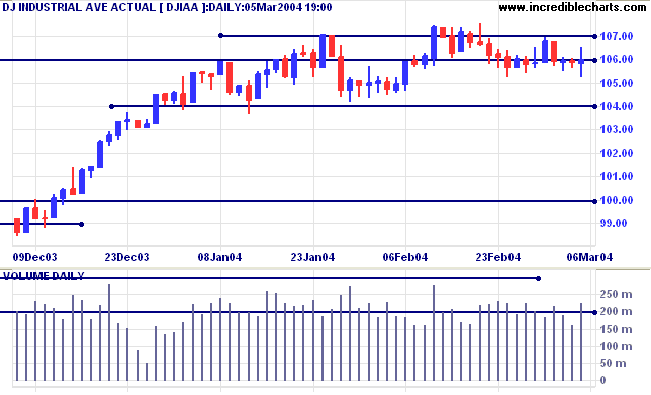
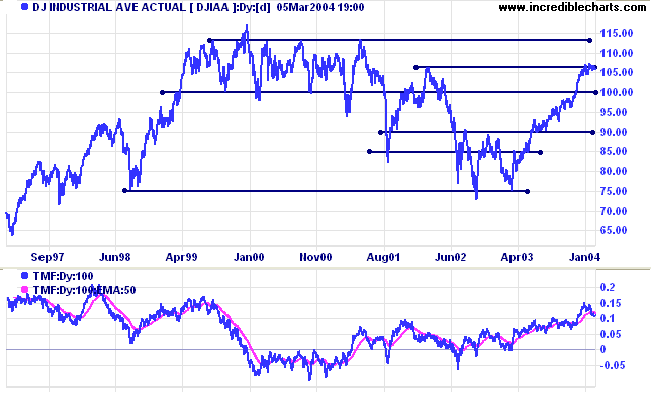
The primary trend is up. Expect strong resistance at 11300 to
11500 (from highs in 1999 to 2001).
Twiggs Money Flow gives a weak distribution signal, having broken below its signal line.
Twiggs Money Flow gives a weak distribution signal, having broken below its signal line.
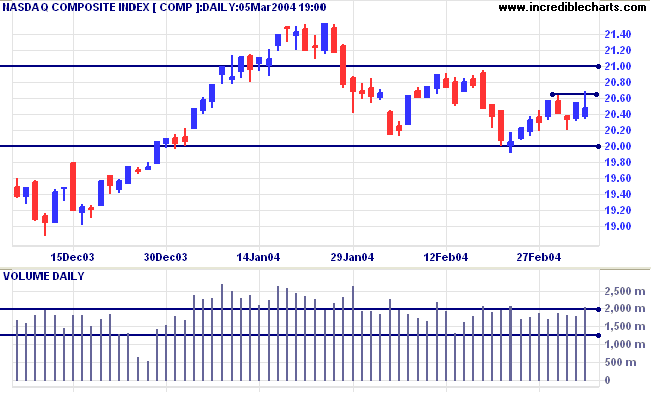
The Nasdaq Composite closed lower at 2047. The false break above
the previous high, coupled with higher volume, favors a re-test
of support at 2000.
The intermediate trend is down.
The primary trend is up. A fall below 1750 would be bearish.
The intermediate trend is down.
The primary trend is up. A fall below 1750 would be bearish.
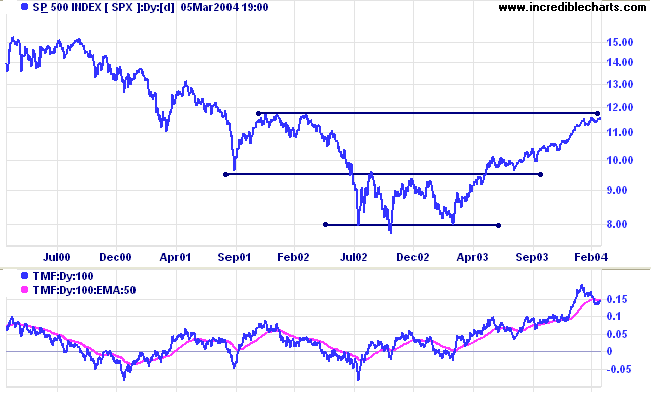
The S&P 500 closed slightly higher at 1157 after a false
break above resistance at 1160. The weak close and higher volume
signal selling pressure, but a successful test of support at the
February 24 low of 1134 will be a bullish sign.
The intermediate trend is uncertain. A rise above 1160 would be bullish. A fall below support at 1120 would be bearish.
The intermediate trend is uncertain. A rise above 1160 would be bullish. A fall below support at 1120 would be bearish.
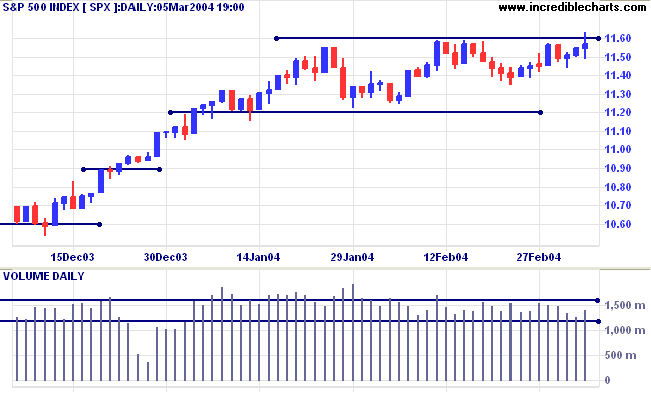
The primary trend is up. Expect resistance at 1170 to 1200;
support at 1000 to 950.
Treasury yields
The yield on 10-year treasury notes closed down sharply at 3.83%, breaking below support at 3.93%.
The intermediate trend is down.
The primary trend has reversed down, after the breakout from the bearish descending triangle.
The yield on 10-year treasury notes closed down sharply at 3.83%, breaking below support at 3.93%.
The intermediate trend is down.
The primary trend has reversed down, after the breakout from the bearish descending triangle.
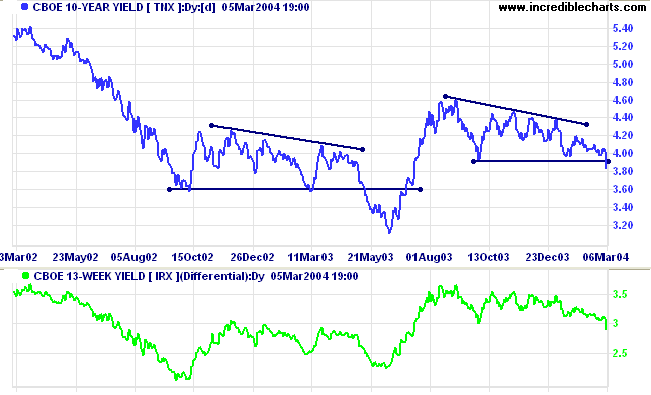
The
yield differential (10-year T-notes compared to 13-week
T-bills) is still healthy, but falling. See
Interest Rates for further explanation.
Gold
New York: Spot gold jumped sharply before Friday's close, ending at $401.00.
The intermediate trend is down.
The primary trend is up. A fall below $370 would signal reversal.
New York: Spot gold jumped sharply before Friday's close, ending at $401.00.
The intermediate trend is down.
The primary trend is up. A fall below $370 would signal reversal.
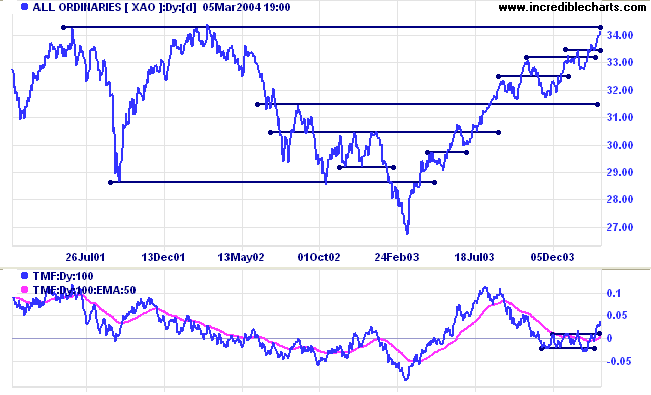
ASX Australia
The All Ordinaries rallied to close at 3416.
Lower volume on a strong bar signals an absence of sellers rather
than commitment from buyers. Overcoming resistance at 3400 may
have depleted both buyers and sellers.
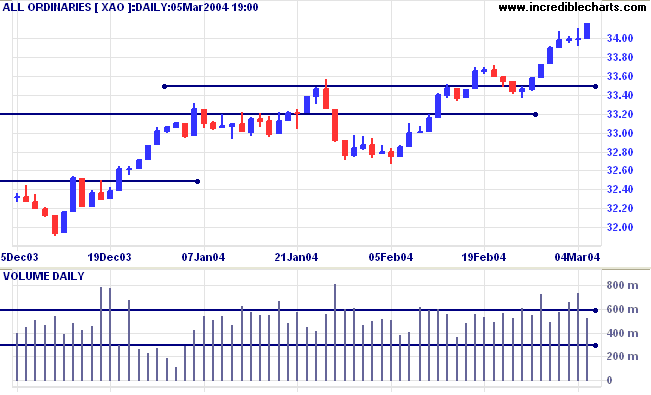
The intermediate trend is up. Buyers may have to consolidate
before making a serious attempt on
Trading Diary
The primary trend is up. Support is at 3160.
Trading Diary
resistance
at 3425 to 3450, the highs from 2001 and 2002
The primary trend is up. Support is at 3160.
Australian sectors
We have had to curtail our coverage of sectors to ensure compliance with Australian Financial Services Regulations. The new weekly format will include coverage of stock screens, indicators, chart patterns, support and resistance and other items of general interest to subscribers.
We have had to curtail our coverage of sectors to ensure compliance with Australian Financial Services Regulations. The new weekly format will include coverage of stock screens, indicators, chart patterns, support and resistance and other items of general interest to subscribers.
Stock Screening - Wide Ranging
Days
Wide ranging days have a significantly wider true range than surrounding bars. They have as much significance as gaps, and often signal a reversal, false break, shake-out, blow-off or strong follow-through after a trend reversal. I have found the Volatility Ratio, introduced by Jack Schwager in his book Schwager on Futures: Technical Analysis, particularly useful. Any day that has a true range more than twice the 14-day average is identified as a wide-ranging day.
Wide ranging days have a significantly wider true range than surrounding bars. They have as much significance as gaps, and often signal a reversal, false break, shake-out, blow-off or strong follow-through after a trend reversal. I have found the Volatility Ratio, introduced by Jack Schwager in his book Schwager on Futures: Technical Analysis, particularly useful. Any day that has a true range more than twice the 14-day average is identified as a wide-ranging day.

- To set up a stock screen filter: select Volatility Ratio (Schwager) > 2.0 within the last 2 days.
Stock Screening - Gaps
Many gaps are also wide ranging days: true range is measured from the previous day's Close to the current High or Low, where this is wider than the current High minus Low. To screen for significant gaps it may be advisable to combine the above Volatility Ratio filter with the following:
Many gaps are also wide ranging days: true range is measured from the previous day's Close to the current High or Low, where this is wider than the current High minus Low. To screen for significant gaps it may be advisable to combine the above Volatility Ratio filter with the following:
- Select Gaps: Price Gapped Up or Price Gapped Down, depending on whether you want bullish or bearish gaps, within the last 2 days.
Stock Screening - Volume Spikes
To narrow your search even further, add a volume spike filter:
To narrow your search even further, add a volume spike filter:
- Select Volume Spikes: Volume exceeds the 50-Day Volume EMA by 2.0 times within the last 2 trading days.
Incredible Charts Premium
version
|
The Chart Forum
The Chart Forum can be accessed from the Home page or from Incredible Charts. It features more than 30,000 posts discussing:
The Chart Forum can be accessed from the Home page or from Incredible Charts. It features more than 30,000 posts discussing:
- stocks (create a separate thread for each new stock);
- market trends;
- chart patterns;
- trading systems; and
- for the more analytical reader - Does Technical Analysis Really Work?
Registering for the Forum
To become a contributor, you need to register.
Open the Forum and create your own username and password (lowercase only).
To become a contributor, you need to register.
Open the Forum and create your own username and password (lowercase only).

You will be sent a confirmation email. Click on the enclosed link
to activate your Forum registration.
Login to your Profile to set up email notifications, edit your profile, remember or change your password.
Login to your Profile to set up email notifications, edit your profile, remember or change your password.
About
the Trading Diary has been expanded to offer further
assistance to readers, including directions on how to search the
archives.
Colin Twiggs
A loser doesn't know what he'll do if he
loses,
but talks about what he'll do if he wins,
and a winner doesn't talk about what he'll do if he wins,
but knows what he'll do if he loses.
~ Eric Berne.
but talks about what he'll do if he wins,
and a winner doesn't talk about what he'll do if he wins,
but knows what he'll do if he loses.
~ Eric Berne.
Back Issues
Click here to access the Trading Diary Archives.
Click here to access the Trading Diary Archives.
Back Issues
Access the Trading Diary Archives.

Author: Colin Twiggs is a former investment banker with almost 40 years of experience in financial markets. He co-founded Incredible Charts and writes the popular Trading Diary and Patient Investor newsletters.
Using a top-down approach, Colin identifies key macro trends in the global economy before evaluating selected opportunities using a combination of fundamental and technical analysis.
Focusing on interest rates and financial market liquidity as primary drivers of the economic cycle, he warned of the 2008/2009 and 2020 bear markets well ahead of actual events.
He founded PVT Capital (AFSL No. 546090) in May 2023, which offers investment strategy and advice to wholesale clients.