Incredible Charts Premium
version
|
Trading Diary
February 28, 2004
These extracts from my daily trading diary
are for educational purposes
and should not be interpreted as investment
advice. Full terms and conditions can be found at Terms
of Use.
USA
The Dow Industrial Average made a false break above support at
10600 before closing down at 10583.
Consolidation below the the level of a recent high is a bearish sign.
The intermediate trend is uncertain. A fall below support at 10400 would signal a re-test of the 10000 level.
Consolidation below the the level of a recent high is a bearish sign.
The intermediate trend is uncertain. A fall below support at 10400 would signal a re-test of the 10000 level.
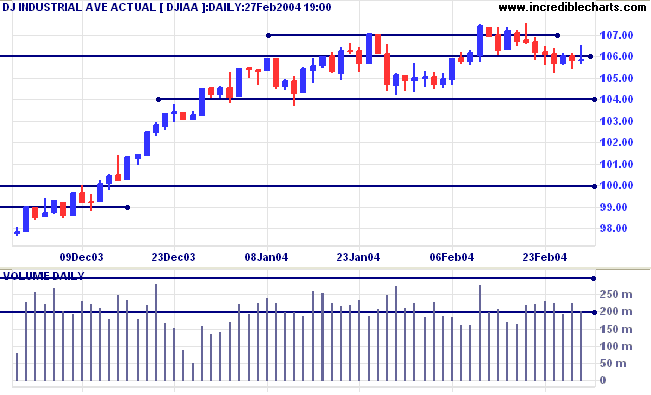
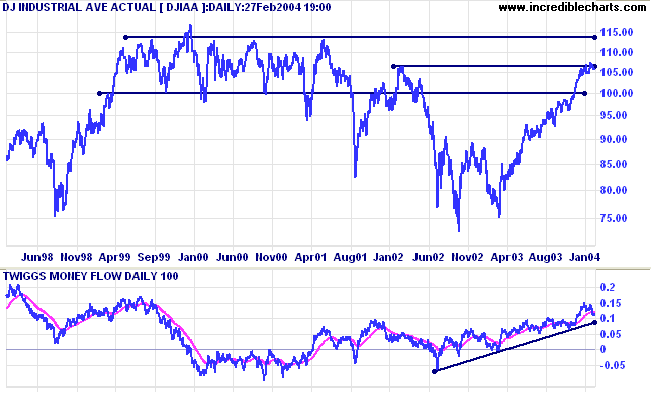
The primary trend is up. Expect strong resistance at 11300 to
11400.
Twiggs Money Flow gives a weak distribution signal, having broken below its signal line.
Twiggs Money Flow gives a weak distribution signal, having broken below its signal line.
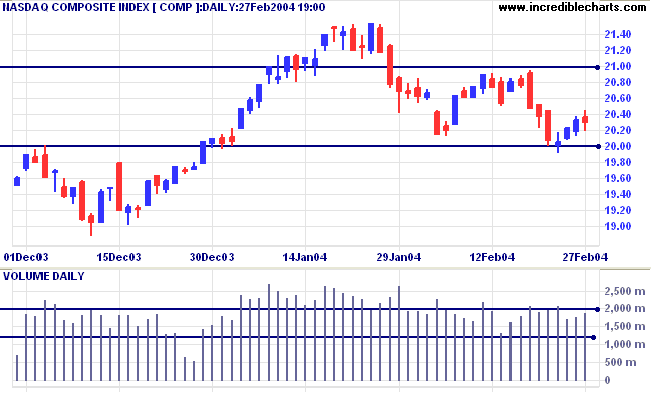
The Nasdaq Composite closed down at 2029. Higher volume and a
weak close signal increased selling pressure, favoring a
reversal.
The intermediate trend is down. Support is at 2000.
The primary trend is up. A fall below 1750 would be bearish.
The intermediate trend is down. Support is at 2000.
The primary trend is up. A fall below 1750 would be bearish.
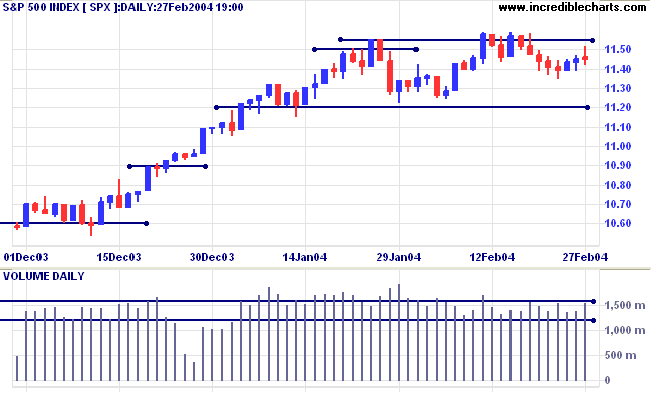
The S&P 500 closed unchanged at 1145. The weak close and
higher volume signal selling pressure, favoring a
reversal.
The intermediate trend is uncertain. A rise above 1155 would be bullish. A fall below support at 1120 would be bearish.
The primary trend is up. Expect strong support at 1000.
The intermediate trend is uncertain. A rise above 1155 would be bullish. A fall below support at 1120 would be bearish.
The primary trend is up. Expect strong support at 1000.
Treasury yields
The yield on 10-year treasury notes closed at 3.984%, below support at 4.0%.
The intermediate trend is down.
The primary trend is up. A bearish descending triangle has formed on the weekly chart; a close below the low of 3.93% would signal reversal.
The yield on 10-year treasury notes closed at 3.984%, below support at 4.0%.
The intermediate trend is down.
The primary trend is up. A bearish descending triangle has formed on the weekly chart; a close below the low of 3.93% would signal reversal.
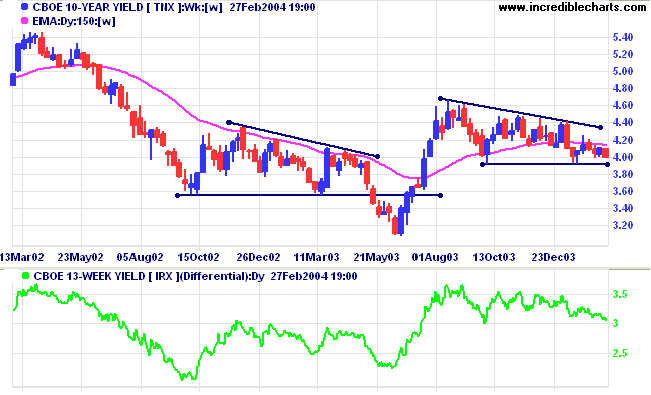
The
yield differential (10-year T-notes compared to 13-week
T-bills) is healthy at above 3.0%. See
Interest Rates for further explanation.
Gold
New York: Spot gold tested support at 390 before closing at $396.10.
The intermediate trend is down.
The primary trend is up. A fall below $370 would signal reversal.
New York: Spot gold tested support at 390 before closing at $396.10.
The intermediate trend is down.
The primary trend is up. A fall below $370 would signal reversal.
ASX Australia
The All Ordinaries rallied to 3372 on strong
volume, making a bullish penetration above the previous
high.
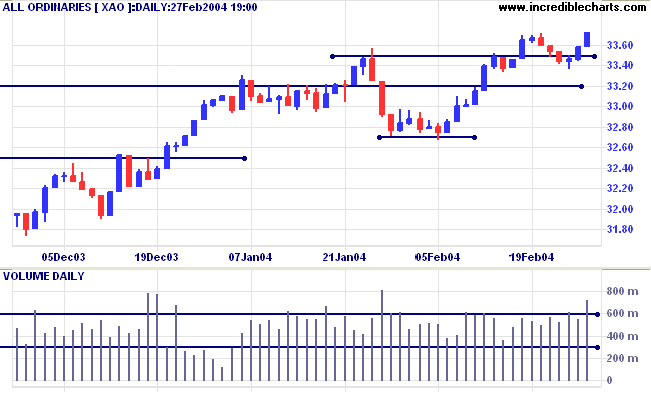
The intermediate trend is up and we are likely
to see a test of resistance at 3425 to 3450 (the highs from
2001 and 2002). A fall below support at 3270 would be
bearish.
The primary trend is up. Support is at 3160.
The primary trend is up. Support is at 3160.
Australian sectors
We have had to curtail our coverage of sectors to ensure compliance with Australian Financial Services Regulations. The new weekly format will include coverage of stock screens, indicators, chart patterns, support and resistance and other items of general interest to subscribers.
We have had to curtail our coverage of sectors to ensure compliance with Australian Financial Services Regulations. The new weekly format will include coverage of stock screens, indicators, chart patterns, support and resistance and other items of general interest to subscribers.
Stock Screening - Trend
Starts
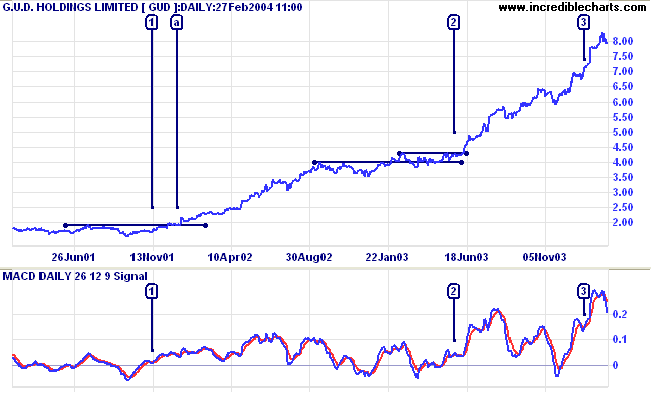
A useful screen for identifying strong trends is the MACD. MACD is a fairly short-term oscillator, plotting the difference between the 26- and 12-day exponential moving averages.
GUD Holdings is one of the better examples of what may turn up. MACD crossovers occur at [1] [2] and [3], while the indicator is above zero. The first two alert us to excellent setups - where price consolidates in a narrow range above a former resistance level, at [a] and at [2], before breaking into a strong up-trend.
A useful screen for identifying strong trends is the MACD. MACD is a fairly short-term oscillator, plotting the difference between the 26- and 12-day exponential moving averages.
-
MACD (26,12,9): select bull signal within the last 3
days.
If you are screening for stocks commencing a down-trend, select bear signal instead.
-
MACD (26,12,9) above/below Zero: select
bull signal within the last 9999 days.
This will return all stocks where MACD is above zero.
If you are screening for stocks commencing a down-trend, select bear signal instead. - Do a sort on the Stock Screen Return: click on the MACD (26,12,9,0) header to arrange stocks in terms of the number of days above zero.
GUD Holdings is one of the better examples of what may turn up. MACD crossovers occur at [1] [2] and [3], while the indicator is above zero. The first two alert us to excellent setups - where price consolidates in a narrow range above a former resistance level, at [a] and at [2], before breaking into a strong up-trend.
Before you rush out and buy every stock where there is an MACD
crossover above zero, Harvey Norman Holdings [HVN] is an
example of how the signals may mis-fire: [1] to [5] are poor
signals before [6] offers a reasonable setup. Most of the poor
signals occurred shortly after MACD had crossed to above zero.
More reliable signals are likely to be found where MACD has
been above zero for at least a month.
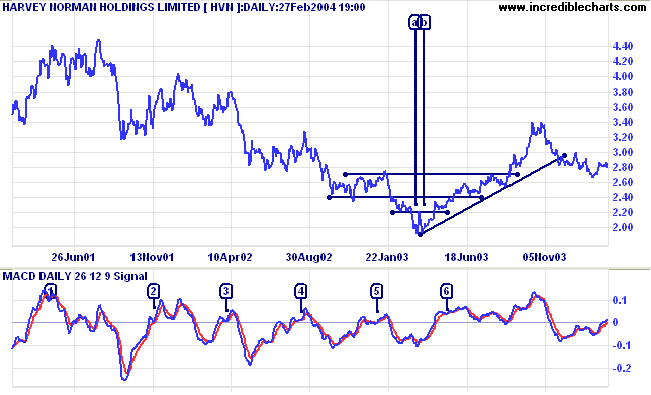
Reversal patterns, like the narrow double bottom at [a] and
[b], may provide earlier setups. So do not rely exclusively on
MACD screening techniques.
Incredible Charts Premium
version
|
Technical Support - Firewalls
If unable to connect to Incredible Charts, configure your firewall to allow IncredibleCharts.exe to contact the following IP addresses:
Norton Personal Firewall or Norton Internet Security
Norton PF or Norton IS may prevent you from connecting to secure (https) servers.
Check Symantec Support to ensure that you have the latest patches and that Block access to secure sites is not activated.
If unable to connect to Incredible Charts, configure your firewall to allow IncredibleCharts.exe to contact the following IP addresses:
- http://66.70.45.174 Port 80 HTTP (TCP)
-
https://66.70.45.174 Port
443 HTTPS (TCP)
- http://app.incrediblecharts.com Port 80 HTTP (TCP)
- https://app.incrediblecharts.com Port 443 HTTPS (TCP)
- Select Tools >> Internet Options >> Security >> Trusted Sites
- Un-check the Require Server Verification (https) box if selected
- Enter the above domain addresses (one at a time) and click the Add button.
Norton Personal Firewall or Norton Internet Security
Norton PF or Norton IS may prevent you from connecting to secure (https) servers.
Check Symantec Support to ensure that you have the latest patches and that Block access to secure sites is not activated.
About
the Trading Diary has been expanded to offer further
assistance to readers, including directions on how to search
the archives.
Colin Twiggs
The conduct of successful business merely
consists in doing things in a very simple way,
doing them regularly and never neglecting to do them.
~ William Hesketh Lever
doing them regularly and never neglecting to do them.
~ William Hesketh Lever
Back Issues
Click here to access the Trading Diary Archives.
Click here to access the Trading Diary Archives.
Back Issues
Access the Trading Diary Archives.

Author: Colin Twiggs is a former investment banker with almost 40 years of experience in financial markets. He co-founded Incredible Charts and writes the popular Trading Diary and Patient Investor newsletters.
Using a top-down approach, Colin identifies key macro trends in the global economy before evaluating selected opportunities using a combination of fundamental and technical analysis.
Focusing on interest rates and financial market liquidity as primary drivers of the economic cycle, he warned of the 2008/2009 and 2020 bear markets well ahead of actual events.
He founded PVT Capital (AFSL No. 546090) in May 2023, which offers investment strategy and advice to wholesale clients.