Subscriptions Renewals
|
Some members are under the impression that their
subscriptions are about to expire and need to be renewed.
The earliest annual subscriptions only expire on May 31,
2004. |
Trading Diary
February 25, 2004
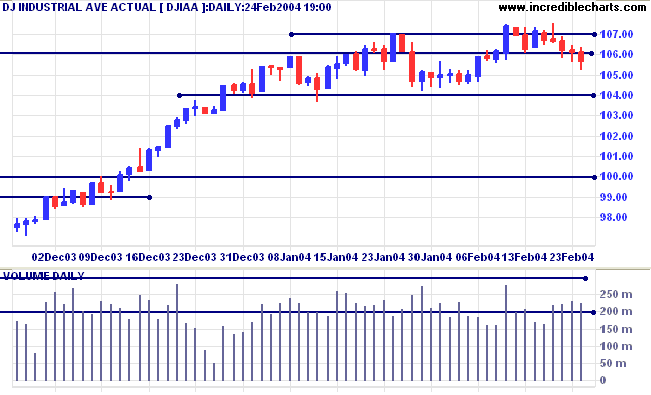
The intermediate trend is uncertain. A fall below support at 10400 would be bearish.
The primary trend is up. Resistance is at 11300 to 11350. A fall below support at 9600 would indicate the start of a down-trend.
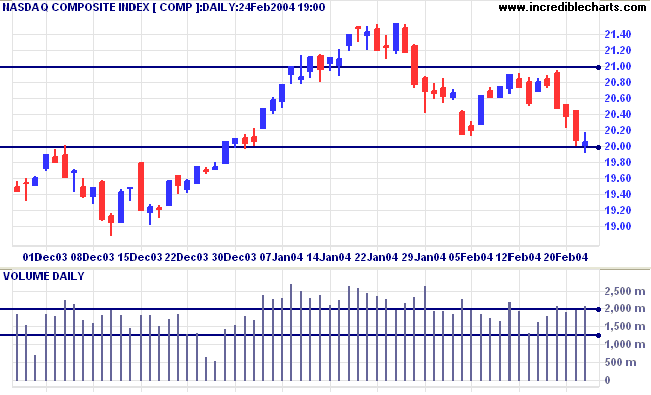
The intermediate trend is down. Narrow consolidation above the 2000 support level would be a bearish sign, indicating that buyers have insufficient strength to stage a rally.
The primary trend is up. A fall below support at 1640 would signal reversal.
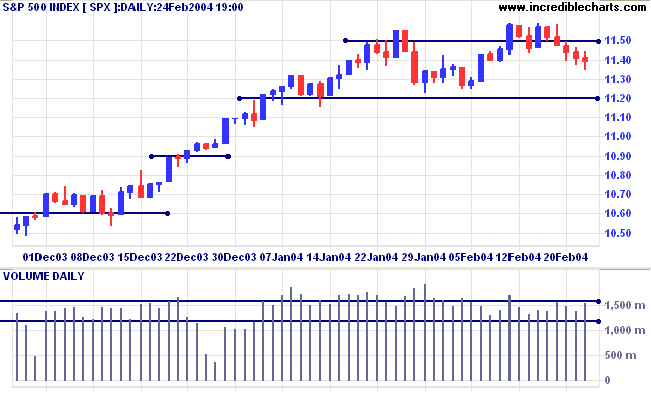
The intermediate trend is uncertain. A rise above 1155 would be bullish. A fall below support at 1120 would signal a down-trend.
The primary trend is up. Expect strong support at 1000. A fall below 960 would signal reversal.
New York (Feb 25 04.47): Spot gold recovered to $403.70.
The intermediate trend is down.
The primary trend is up. A fall below $370 would signal reversal.
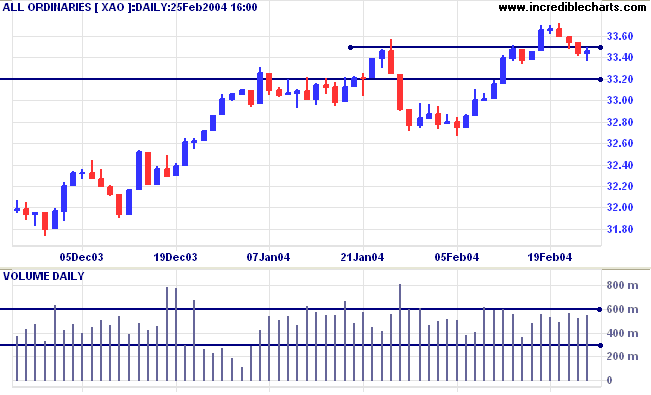
The primary trend is up. Support is at 3160.
Many traders basic trading style relies on buying dips in an up-trend and, conversely, selling rallies in a down-trend. A retracement (or dip) is a move counter to the direction of the up-trend. The ideal retracement has:
- a short duration (no more than 3 or 4 days);
- contracting bars, signaling that sellers interest is waning;
- declining volume, confirming the lack of interest from sellers; and
- a final downward bar with a narrow range and low volume.
-
Moving Average Crossover: 10-day and 50-day
moving averages; bull signal within
the last 9999 days.
I had better explain the 9999 days: if you want all stocks where the fast MA is above the slow MA, insert 9999; if you want only stocks where the fast MA crossed above the slow MA today, insert 1.
-
RSI 5-Day (Wilder) Crossover of 80/20
Percentile: select bear signal within the
last 4 days.
The oscillator time period is relatively short-term and should pick up most minor dips in an otherwise healthy up-trend. We select the bear signal as we want to screen for stocks where the RSI is turning down. And we limit the return to signals in the last 4 days: retracements that started more than 4 days ago do not fit our criteria.
- Never enter a trade on the strength of a stock screen. Always analyze the individual charts to assess whether the stock returned is a suitable candidate.
- Never trade against the direction of the market or the sector (in some cases the industry). Always assess the direction of the market before setting your screens. And always compare to other stocks in the sector.
and once we've made up our minds about those beliefs,
we're not likely to change them. And when we play the markets,
we assume that we are considering all of the available information.
Instead, our beliefs, through selective perception,
may have eliminated the most useful information.
~ Van K Tharp: Trade Your Way to Financial Freedom.
You can now view back issues at the Daily Trading Diary Archives.
Back Issues

Author: Colin Twiggs is a former investment banker with almost 40 years of experience in financial markets. He co-founded Incredible Charts and writes the popular Trading Diary and Patient Investor newsletters.
Using a top-down approach, Colin identifies key macro trends in the global economy before evaluating selected opportunities using a combination of fundamental and technical analysis.
Focusing on interest rates and financial market liquidity as primary drivers of the economic cycle, he warned of the 2008/2009 and 2020 bear markets well ahead of actual events.
He founded PVT Capital (AFSL No. 546090) in May 2023, which offers investment strategy and advice to wholesale clients.