Daily Trading Diary - Subscriptions
|
We have removed the Daily Trading Diary from the
subscription page until the new format is
resolved. |
Trading Diary
February 24, 2004
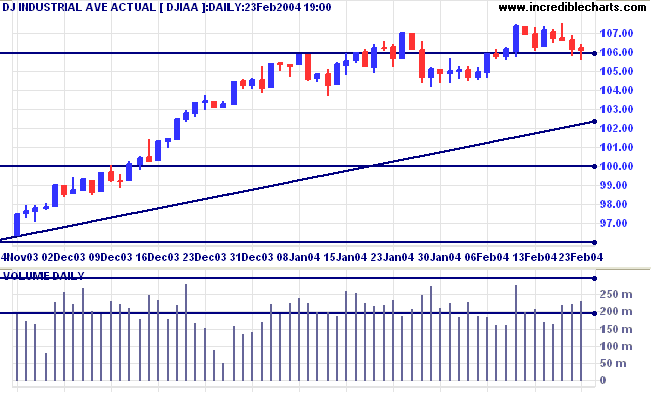
A fall below the January 29 low of 10417 would signal a re-test of support at 10000.
The primary trend is up. Resistance is at 11300 to 11350. A fall below support at 9600 would indicate the start of a down-trend.
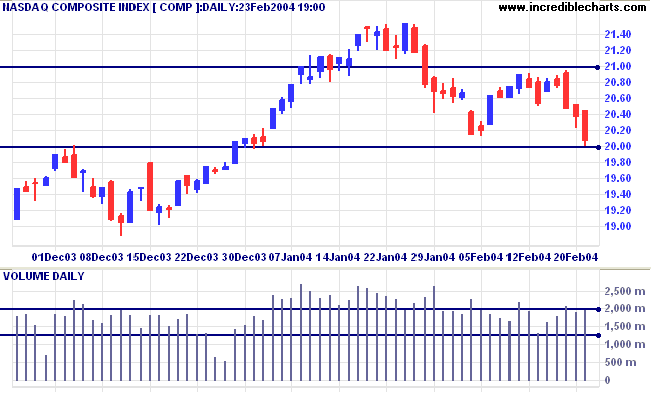
The intermediate trend is down.
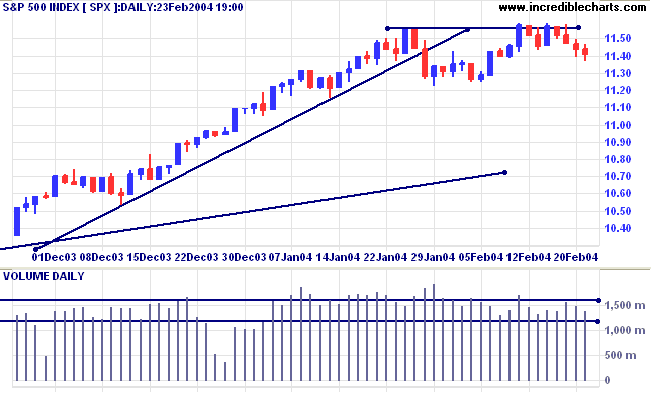
The primary trend is up. A fall below support at 1640 would signal reversal.
The intermediate trend is uncertain. A rise above 1155 would be bullish. A fall below support at 1122 would signal a down-trend.
The primary trend is up. Expect strong support at 1000. A fall below 960 would signal reversal.
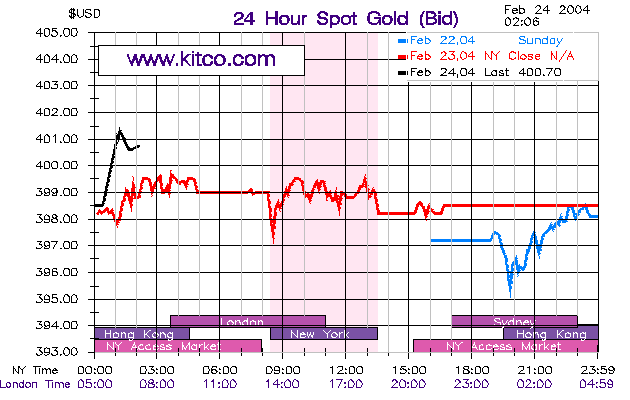
New York (Feb 24 02:06): Spot gold recovered to $400.70.
The intermediate trend is down.
The primary trend is up. A fall below $370 would signal reversal.
The primary trend is up. Resistance is at the 2001/2002 highs of 3425 and 3440. Support is at 3160.
Correction to yesterday's Diary:
-
To eliminate stocks already in strong
trending moves:
enter 25 as the Maximum % Move for 1, 3 and 6 months.
Welles Wilder's Directional Movement system measures the ability of buyers and sellers to move price above or below the previous day's trading range. There are 3 lines:
- The Positive Direction Indicator (+DI) summarizes upward trend movement;
- The Negative Direction Indicator (-DI) summarizes downward trend movement; and
- The Average Directional Movement Index (ADX) indicates whether the market is trending or ranging.
Our screen will therefore include:
- Directional Movement ADX Crossover: crosses above 25 within the last 5 days;
- % Price Move: enter 25 as the Maximum for 1, 3 and 6 months.
What we really need is an additional filter where we can set the minimum time that ADX must be below 25 (to filter out stocks where ADX whipsaws above and below 25). This is on our list for the planned upgrade of the stock screens.
We can make our lives sublime,
And, departing, leave behind us
Footprints on the sands of time.
~ Henry Wadsworth Longfellow
(1807 - 1882).
You can now view back issues at the Daily Trading Diary Archives.
Back Issues

Author: Colin Twiggs is a former investment banker with almost 40 years of experience in financial markets. He co-founded Incredible Charts and writes the popular Trading Diary and Patient Investor newsletters.
Using a top-down approach, Colin identifies key macro trends in the global economy before evaluating selected opportunities using a combination of fundamental and technical analysis.
Focusing on interest rates and financial market liquidity as primary drivers of the economic cycle, he warned of the 2008/2009 and 2020 bear markets well ahead of actual events.
He founded PVT Capital (AFSL No. 546090) in May 2023, which offers investment strategy and advice to wholesale clients.