Automatic Free Trial
|
New subscribers will receive an
automatic free trial when they download Incredible
Charts. They will not have not have to click any buttons
in future to activate the free trial. The same will apply
to existing subscribers with unexpired free
trials. |
Trading Diary
February 20, 2004
A fall below the January 29 low of 10417 would signal a re-test of support at 10000.
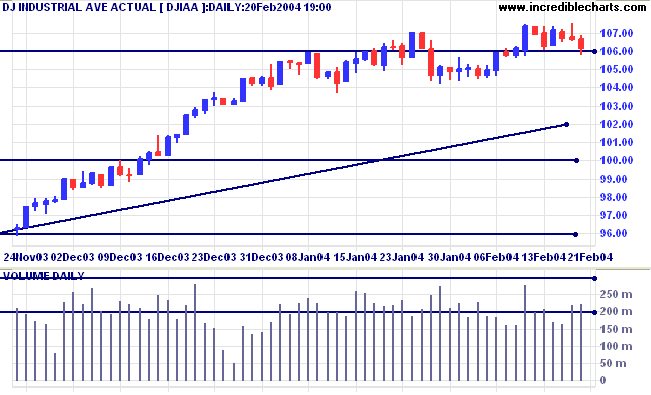
Twiggs Money Flow gives a weak distribution signal, having broken below its signal line.
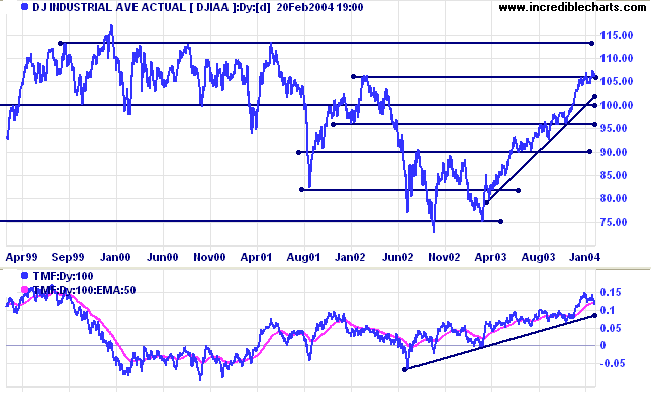
The intermediate trend is down. Support is at 2000.
The primary trend is up. A fall below support at 1640 would signal reversal.
Twiggs Money Flow is below its signal line. A retracement that fails to cross above this line would give a strong bear signal.
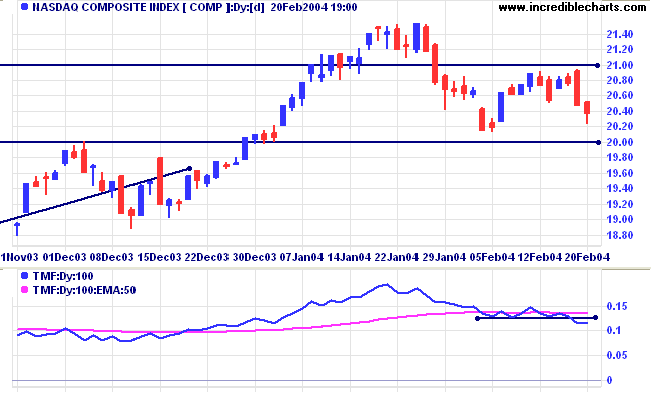
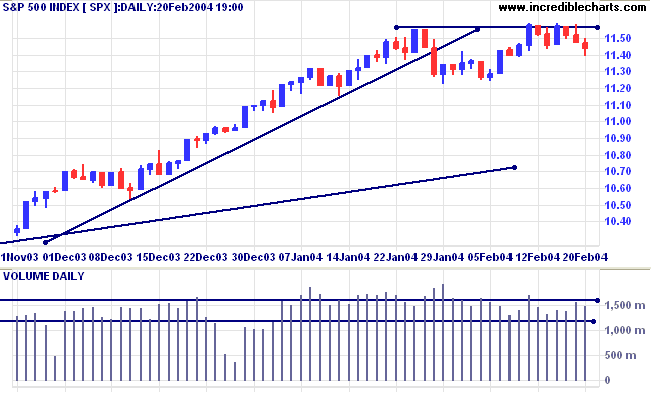
The intermediate trend is uncertain. A rise above 1155 would be bullish. A fall below support at 1122 would signal a down-trend.
The primary trend is up. Expect strong support at 1000. A fall below 960 would signal reversal.
New unemployment claims fell to 344,000, compared to 368,000 the week before. (more)
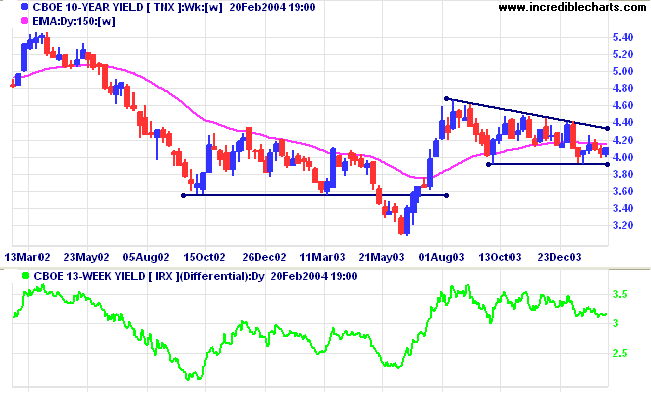
The yield on 10-year treasury notes closed at 4.10%.
The intermediate trend is down.
The primary trend is up. A bearish descending triangle has formed on the weekly chart; a close below the low of 3.93% would signal reversal.
New York: Spot gold fell through support at 400, closing at $397.20.
The intermediate trend is down.
The primary trend is up. A fall below $370 would signal reversal.
Subscribe
to Incredible Charts:
|
for only $18 (AUD) per month
For the fast up-trend to continue, the index must respect support at 3350. A follow-through above the high of 3372 will be a bull signal. A fall below Monday's low of 3333 would be bearish.
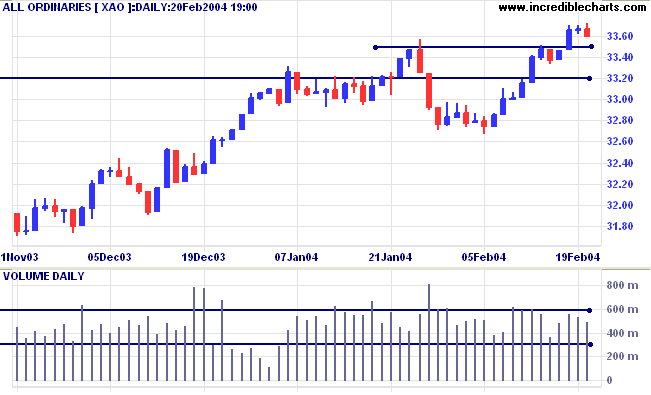
The primary trend is up. Resistance is at the 2001/2002 highs of 3425 and 3440. Support is at 3160.
The 11 sectors (10 + Property) are in various market stages. Relative Strength (xjo) measures the performance of each sector relative to the overall index.
- Energy [XEJ] - stage 2 (RS is rising)
- Materials [XMJ] - stage 2 (RS is level)
- Industrials [XNJ] - stage 2 (RS is rising)
- Consumer Discretionary [XDJ] - stage 3 (RS is level)
- Consumer Staples [XSJ] - stage 3 (RS is falling)
- Health Care [XHJ] - stage 1 (RS is falling)
- Property Trusts [XPJ] - stage 3 (RS is level).
- Financial excl. Property [XXJ] - stage 2 (RS is rising)
- Information Technology [XIJ] - stage 3 (RS is level)
- Telecom Services [XTJ] - stage 3 (RS is falling)
- Utilities [XUJ] - stage 2 (RS is level)
A stock screen of the ASX 200 using % Price Move (1 month: +5%) increased to 40 stocks, from 21 two weeks ago.
The highest reading was 131 on April 11, 2003 and the lowest was 8 on March 14, 2003.
Prominent sectors:
- Diversified Metals & Mining (5)
- Construction Materials (3)
- Banks (3)
(The figure in brackets show the number of stocks returned from that industry).
~ Aristotle.
You can now view back issues at the Daily Trading Diary Archives.
Back Issues

Author: Colin Twiggs is a former investment banker with almost 40 years of experience in financial markets. He co-founded Incredible Charts and writes the popular Trading Diary and Patient Investor newsletters.
Using a top-down approach, Colin identifies key macro trends in the global economy before evaluating selected opportunities using a combination of fundamental and technical analysis.
Focusing on interest rates and financial market liquidity as primary drivers of the economic cycle, he warned of the 2008/2009 and 2020 bear markets well ahead of actual events.
He founded PVT Capital (AFSL No. 546090) in May 2023, which offers investment strategy and advice to wholesale clients.