Trading Diary Changes
|
We have consolidated the two daily updates
into one afternoon edition. This will be dated at the time
of issue (not the date of the market close, which succeeded
in confusing many readers). We are experimenting with more in-depth coverage but of fewer stocks. Readers appear to be split down the middle on this: some want more stock coverage while others want more in-depth coverage. Considering recent changes to Financial Services regulations, I have opted for the latter course to avoid analysis being mistaken for financial advice. |
Trading Diary
February 20, 2004
These extracts from my daily trading diary are
for educational purposes and should not be interpreted as
investment advice. Full terms and conditions can be found at
Terms
of Use .
USA (February 19)
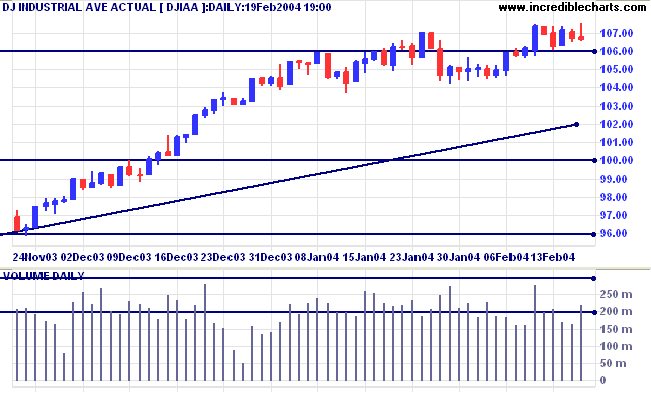
The Dow Industrial Average retreated to
10664 after testing resistance. The weak close and higher volume
signal selling pressure.
The intermediate trend is up. The index is consolidating above 10600; generally a bullish sign in an up-trend. A break above 10747 would be bullish; below 10600, bearish.
The primary trend is up. Resistance is at 11300 to 11350. A fall below support at 9600 would signal the start of a down-trend.
The intermediate trend is up. The index is consolidating above 10600; generally a bullish sign in an up-trend. A break above 10747 would be bullish; below 10600, bearish.
The primary trend is up. Resistance is at 11300 to 11350. A fall below support at 9600 would signal the start of a down-trend.
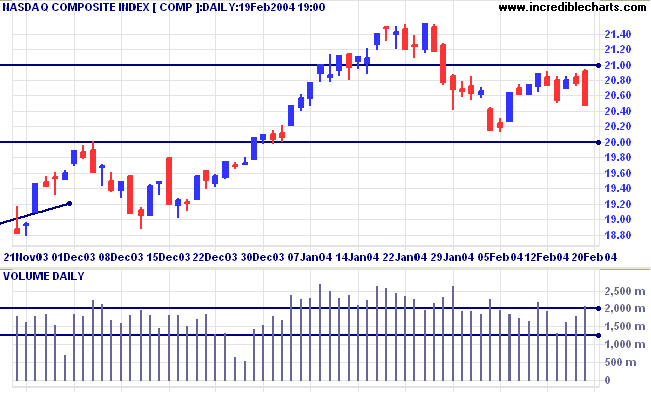
The Nasdaq Composite closed down sharply
at 2046. Strong volume and a close below the previous low of 2049
signals a re-test of support levels.
The intermediate trend is down. Initial support is at 2000.
The primary trend is up. A fall below support at 1640 would signal reversal.
The intermediate trend is down. Initial support is at 2000.
The primary trend is up. A fall below support at 1640 would signal reversal.
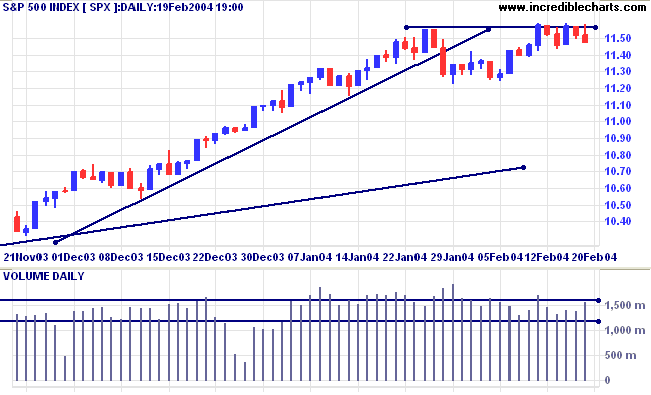
The S&P 500 also tested resistance
before retreating to close at 1147. The weak close and higher
volume indicate selling pressure.
A rise above 1159 would be bullish.
The intermediate trend is up. A fall below the January 29 low of 1122 would be bearish.
The primary trend is up. Expect strong support at 1000. A fall below 960 would signal reversal.
A rise above 1159 would be bullish.
The intermediate trend is up. A fall below the January 29 low of 1122 would be bearish.
The primary trend is up. Expect strong support at 1000. A fall below 960 would signal reversal.
The Chartcraft NYSE Bullish % Indicator increased
slightly to 85.97%.
Gold
New York (03.06): Spot gold eased to $407.60.
The intermediate trend is up. Support is at 400.
The primary trend is up. A fall below $370 would signal reversal.
New York (03.06): Spot gold eased to $407.60.
The intermediate trend is up. Support is at 400.
The primary trend is up. A fall below $370 would signal reversal.
ASX Australia (February
20)
The All Ordinaries retreated to 3359. Lighter
volume indicates that sellers lack commitment.
For the fast up-trend to continue, the index must respect support at 3350. A follow-through above the high of 3372 will be a bull signal. A fall below Monday's low of 3333 would be bearish.
For the fast up-trend to continue, the index must respect support at 3350. A follow-through above the high of 3372 will be a bull signal. A fall below Monday's low of 3333 would be bearish.
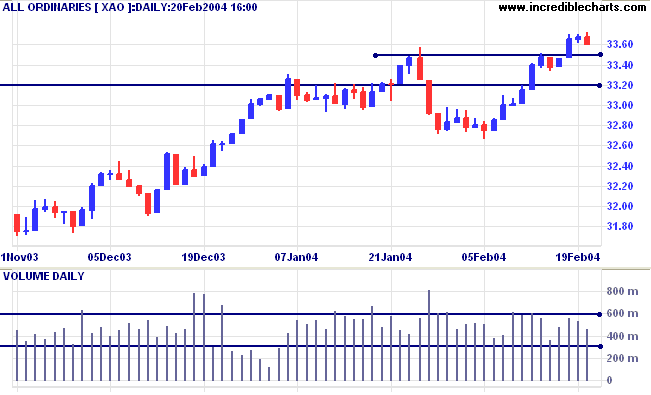
The intermediate trend is up. A fall below
support at 3320 would be bearish.
The primary trend is up. Resistance is at the 2001/2002 highs of 3425 and 3440. Support is at 3160.
The primary trend is up. Resistance is at the 2001/2002 highs of 3425 and 3440. Support is at 3160.
Adjusting stops and exits
"Before entering a trade -
1. Know your entry
2. Know your risk
3. Know your exit
4. Know you will stick to them" - from Adam (opm) on the Chart Forum.
The target for the NAB pattern is around 33.00: 31.00 + (31.00 - 29.00).
Assuming an average entry price of 31.00 and a stop loss at 30.40, your potential loss is roughly 2%. Add brokerage and slippage and you are likely to face a total risk of 2.5% to 3.0%.
Projected return is 6.5%: (33.00 / 31.00 - 1 )* 100%; giving a risk-reward ratio of between 2.6 and 2.1.
High brokerage costs lower your risk-reward ratio and reduce your safety margin.
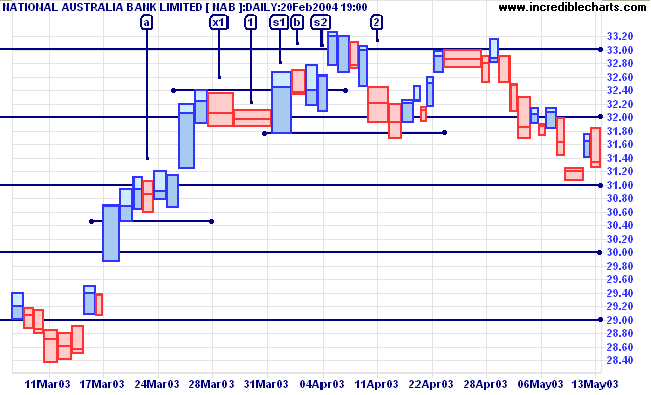
Some short-term traders will exit on the first
bar with a lower low [x1]. This does not afford much opportunity
to lock in profits, except using intra-day highs and lows.
Another strategy worth considering is to continue holding through consolidations/ retracements, provided the fast up-trend continues. A fast up-trend has no overlap between short-term troughs and preceding peaks; so the position will be exited at the first bar [b] to break below support (32.40) from a previous high.
Adjusting stops to lock in profits is a tricky business, increasing the risk of being taken out too early in the trend. Adjust stops up to below the low of subsequent retracements: [s1] and [s2]. Retracements should be at least 2 days duration, unless in a blow-off spike. Do not adjust the stop until price has rallied above resistance from the previous short-term high: above 32.40 in the case of [s1].
Stop [s2] is activated on day [2] when price falls below 32.00.
About
the Trading Diary has been expanded to offer further
assistance to readers, including directions on how to search the
archives.
Colin Twiggs
There are virtuous and peaceful
individuals whose pure morality, quiet habits, opulence, and
talents fit them to be the leaders of the surrounding population.
Their love of country is sincere, and they are ready to make the
greatest sacrifices for its welfare. But civilization often finds
them among its opponents; they confound its abuses with its
benefits, and the idea of evil is inseparable in their minds from
that of novelty. Near these I find others, whose object is to
materialize mankind, to hit upon what is expedient without
heeding what is just, to acquire knowledge without faith, and
prosperity apart from virtue; claiming to be the champions of
modern civilization, they place themselves arrogantly at its
head, usurping a place which is abandoned to them, and of which
they are wholly unworthy.
~ Alexis de Tocqueville in his 1830s treatise: Democracy in America.
~ Alexis de Tocqueville in his 1830s treatise: Democracy in America.
Stock Screens: Suggestions
| We will be revising the Stock Screens over the next few weeks. Many readers have already offered suggestions for improvements, but if you have any further requests, please email Support, with Stock Screen Suggestions in the subject line. |
Back Issues
You can now view back issues at the Daily Trading Diary Archives.
You can now view back issues at the Daily Trading Diary Archives.
Back Issues
Access the Trading Diary Archives.

Author: Colin Twiggs is a former investment banker with almost 40 years of experience in financial markets. He co-founded Incredible Charts and writes the popular Trading Diary and Patient Investor newsletters.
Using a top-down approach, Colin identifies key macro trends in the global economy before evaluating selected opportunities using a combination of fundamental and technical analysis.
Focusing on interest rates and financial market liquidity as primary drivers of the economic cycle, he warned of the 2008/2009 and 2020 bear markets well ahead of actual events.
He founded PVT Capital (AFSL No. 546090) in May 2023, which offers investment strategy and advice to wholesale clients.