Trading Diary Changes
|
We have consolidated the two daily updates
into one afternoon edition. This will be dated at the time
of issue (not the date of the market close, which succeeded
in confusing many readers). We are experimenting with more in-depth coverage but of fewer stocks. Readers appear to be split down the middle on this: some want more stock coverage while others want more in-depth coverage. Considering recent changes to Financial Services regulations, I have opted for the latter course to avoid analysis being mistaken for financial advice. Please give us your feedback at the Chart Forum: Trading Diary Feedback. |
Trading Diary
February 19, 2004
These extracts from my daily trading diary are
for educational purposes and should not be interpreted as
investment advice. Full terms and conditions can be found at
Terms
of Use .
USA (February 18)
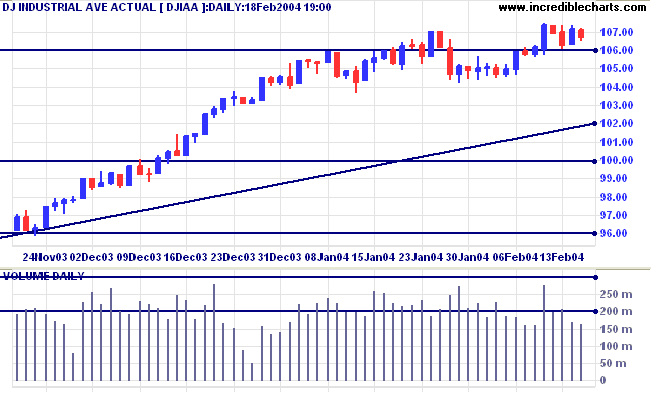
The Dow Industrial Average closed down at
10672. An inside day and low volume signals a lack of commitment
from both buyers and sellers.
The intermediate trend is up. The index is consolidating above the new support level at 10600; generally a bullish sign in an up-trend. A break above 10747 would be bullish; below 10600 would be bearish.
The primary trend is up. Resistance is at 11300 to 11350. A fall below support at 9600 would indicate the start of a down-trend.
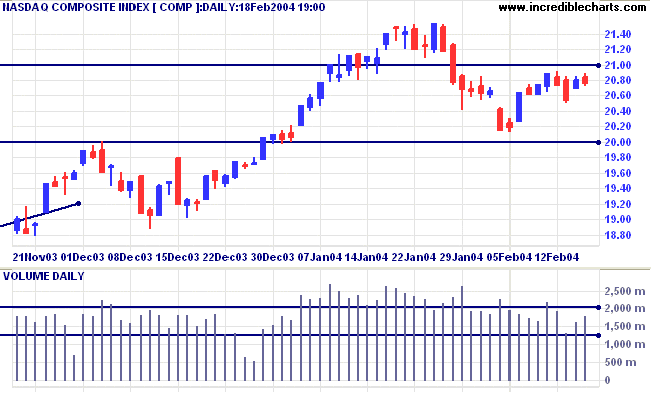
The Nasdaq Composite closed down slightly
at 2076. The narrow range and higher volume signal selling
pressure.
The intermediate trend is down. Support is at 2000.
The primary trend is up. A fall below support at 1640 would signal reversal.
The intermediate trend is down. Support is at 2000.
The primary trend is up. A fall below support at 1640 would signal reversal.
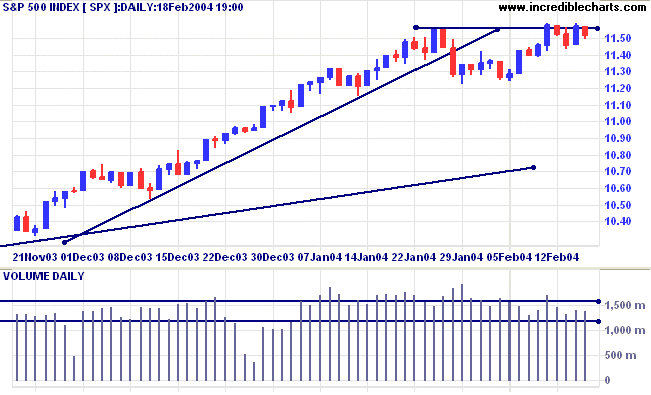
The S&P 500 is consolidating under
the resistance level on average volume; a bullish sign in an
up-trend.
A rise above 1159 would be bullish. Below Friday's low of 1143, bearish.
The intermediate trend is up.
The primary trend is up. Expect strong support at 1000. A fall below 960 would signal reversal.
A rise above 1159 would be bullish. Below Friday's low of 1143, bearish.
The intermediate trend is up.
The primary trend is up. Expect strong support at 1000. A fall below 960 would signal reversal.
The Chartcraft NYSE Bullish % Indicator increased
slightly to 85.91%.
Treasury yields
The yield on 10-year treasury notes continues to consolidate at 4.05%, a bearish sign in an intermediate down-trend.
The primary trend is up. A close below the September low of 3.93% would signal reversal.
The yield on 10-year treasury notes continues to consolidate at 4.05%, a bearish sign in an intermediate down-trend.
The primary trend is up. A close below the September low of 3.93% would signal reversal.
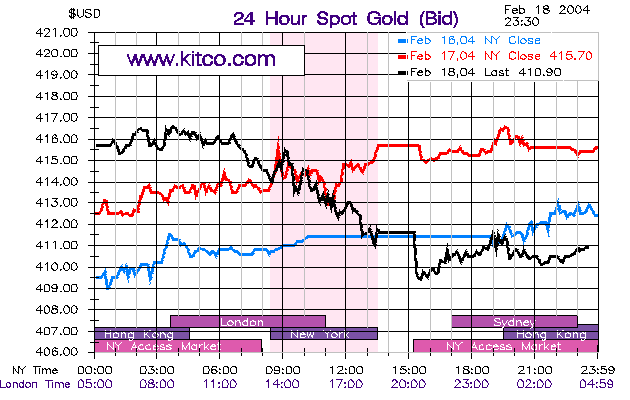
Gold
New York: Spot gold fell to $410.90 (23.30 a.m.).
The intermediate trend is up.
The primary trend is up. A fall below $370 would signal reversal.
New York: Spot gold fell to $410.90 (23.30 a.m.).
The intermediate trend is up.
The primary trend is up. A fall below $370 would signal reversal.
ASX Australia (February 19)
The All Ordinaries consolidated, testing back
into the previous day's bar. For the fast up-trend to continue,
the index must respect the new 3350 support level. A
follow-through above the high of 3370 will be a bull signal. A
fall below Monday's low of 3333 would be bearish.
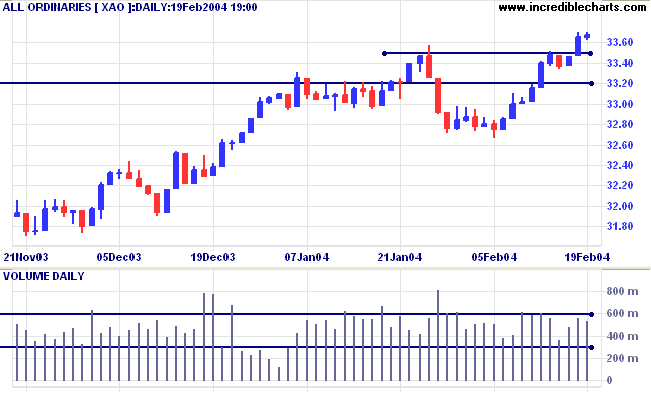
The intermediate trend is up. A fall below
support at 3320 would be bearish.
The primary trend is up. Resistance is at the 2001/2002 highs of 3425 and 3440.
Support is at 3160.
The primary trend is up. Resistance is at the 2001/2002 highs of 3425 and 3440.
Support is at 3160.
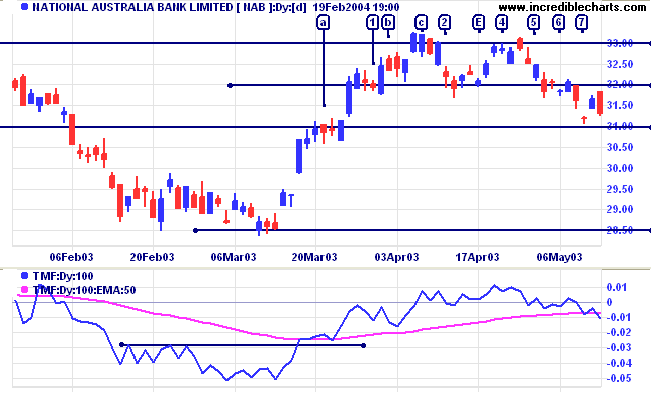
Twiggs Money Flow and Relative
Strength
Before analyzing any stock in detail, I find it useful to consult my two most trusted indicators: Twiggs Money Flow and Relative Strength. I use them to alert me to potentially profitable trades; not to generate buy/sell signals.
Taking the NAB (March 2003) example from yesterday: TMF broke above the 1-month resistance level, pulled back slightly a day or two later, then rallied without crossing below the new support level. A bull signal.
Twiggs Money Flow is one of the indicators we plan to add to the Stock Screens in the next few weeks.
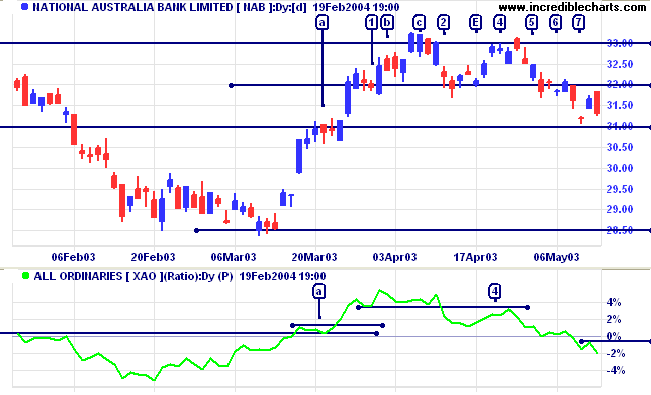
At the same time Relative strength (price ratio:
xao) had crossed above its 3-month resistance line, pulled back
slightly and then rallied again, respecting the new support line
at [a]. Another bull signal.
In a shorter time frame the consolidation at [a] would appear as a creeping up-trend. Jack Schwager treats these as flags, maintaining that they are just as reliable continuation signals as regular flags that run against the trend.
Note how price tends to move in steps, with support/resistance forming at 31.00, 32.00, 33.00 and so on. Occasionally a level forms at the half-way mark (e.g. 28.50). This is a common occurrence with NAB and other major stocks.
Consolidation below a resistance level is a bullish sign. Entries during the consolidation should have tight stops, in case the pattern springs a nasty surprise. Otherwise you take your chances at the breakout.
Tight stops can be placed just below 30.50. When
placing stops, bear in mind that price seldom stops neatly at the
support or resistance level. There are a large number of false
breaks; where price overruns before retreating. This is most
important when adjusting stops.
More tomorrow.
More tomorrow.
About
the Trading Diary has been expanded to offer further
assistance to readers, including directions on how to search the
archives.
Colin Twiggs
Intelligence is not to make no mistakes,
but quickly to see how to make them good.
~ Bertolt Brecht.
but quickly to see how to make them good.
~ Bertolt Brecht.
Stock Screens: Suggestions
| We will be revising the Stock Screens over the next few weeks. Many readers have already offered suggestions for improvements, but if you have any further requests, please email Support, with Stock Screen Suggestions in the subject line. |
Back Issues
You can now view back issues at the Daily Trading Diary Archives.
You can now view back issues at the Daily Trading Diary Archives.
Back Issues
Access the Trading Diary Archives.

Author: Colin Twiggs is a former investment banker with almost 40 years of experience in financial markets. He co-founded Incredible Charts and writes the popular Trading Diary and Patient Investor newsletters.
Using a top-down approach, Colin identifies key macro trends in the global economy before evaluating selected opportunities using a combination of fundamental and technical analysis.
Focusing on interest rates and financial market liquidity as primary drivers of the economic cycle, he warned of the 2008/2009 and 2020 bear markets well ahead of actual events.
He founded PVT Capital (AFSL No. 546090) in May 2023, which offers investment strategy and advice to wholesale clients.