Trading Diary Changes
|
We have consolidated the two daily updates
into one afternoon edition. This will be dated at the time
of issue (not the date of the market close, which succeeded
in confusing many readers). We are experimenting with more in-depth coverage but of fewer stocks. Readers appear to be split down the middle on this: some want more stock coverage while others want more in-depth coverage. Considering recent changes to Financial Services regulations, I have opted for the latter course to avoid future analysis being mistaken for financial advice. Please give us your feedback at the Chart Forum: Trading Diary Feedback. |
Trading Diary
February 18, 2004
These extracts from my daily trading diary are
for educational purposes and should not be interpreted as
investment advice. Full terms and conditions can be found at
Terms
of Use .
USA (February 17)
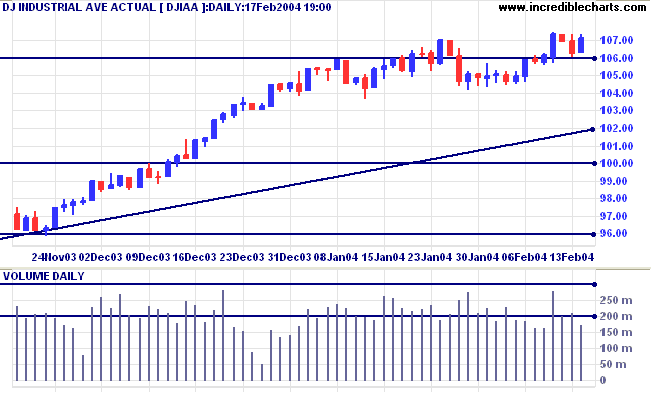
The Dow Industrial Average closed last
night at 10715 after testing resistance at the recent high. Low
volume signals a lack of commitment from buyers.
The intermediate trend is up. A rise above 10747 would be bullish. A fall below 10600, bearish.
The primary trend is up. Resistance is at 11300 to 11350. A fall below support at 9600 would indicate the start of a down-trend.
The intermediate trend is up. A rise above 10747 would be bullish. A fall below 10600, bearish.
The primary trend is up. Resistance is at 11300 to 11350. A fall below support at 9600 would indicate the start of a down-trend.
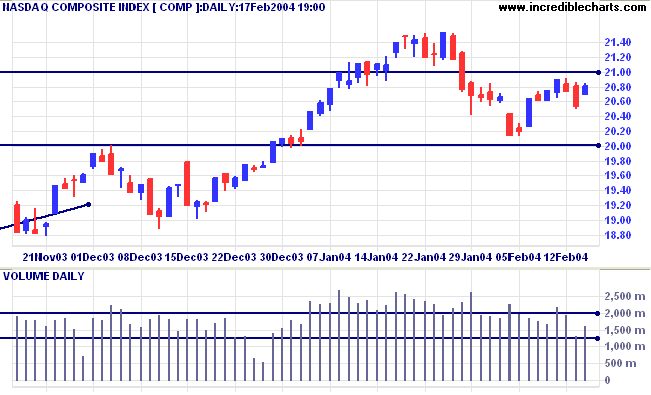
The Nasdaq Composite formed a narrow
inside day, closing at 2080. Higher volume and a fairly strong
close are bullish signs.
The intermediate trend is down. Support is at 2000.
The primary trend is up. A fall below support at 1640 would signal reversal.
The intermediate trend is down. Support is at 2000.
The primary trend is up. A fall below support at 1640 would signal reversal.
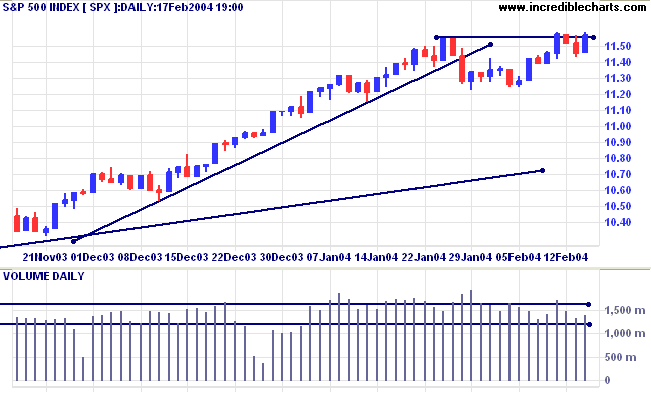
The S&P 500 tested resistance at the
recent high before closing at 1157. Slightly higher volume and a
strong close are bullish signs.
The intermediate trend is up. A rise above 1159 would be bullish. Below Friday's low of 1143, bearish.
The primary trend is up. Expect strong support at 1000. A fall below 960 would signal reversal.
The intermediate trend is up. A rise above 1159 would be bullish. Below Friday's low of 1143, bearish.
The primary trend is up. Expect strong support at 1000. A fall below 960 would signal reversal.
The Chartcraft NYSE Bullish % Indicator is up at
85.81%.
Consumer Confidence falls sharply
The ABC News consumer confidence poll falls 7 points in a single week. (more)
The ABC News consumer confidence poll falls 7 points in a single week. (more)
Treasury yields
The yield on 10-year treasury notes is consolidating at 4.05%, a bearish sign in an intermediate down-trend.
The primary trend is up. A close below the September low of 3.93% would signal reversal.
The yield on 10-year treasury notes is consolidating at 4.05%, a bearish sign in an intermediate down-trend.
The primary trend is up. A close below the September low of 3.93% would signal reversal.
Gold
New York: Spot gold has rallied to $415.90 (02:51 a.m.).
The intermediate trend has turned up.
The primary trend is up. A fall below $370 would signal reversal.
New York: Spot gold has rallied to $415.90 (02:51 a.m.).
The intermediate trend has turned up.
The primary trend is up. A fall below $370 would signal reversal.
ASX Australia (February 18)
The All Ordinaries broke through resistance from
the previous high to close at 3365. Higher volume signals
commitment from buyers. The new support level is at 3350.
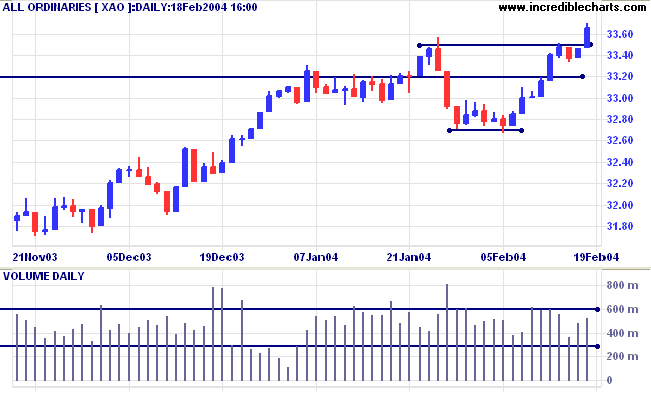
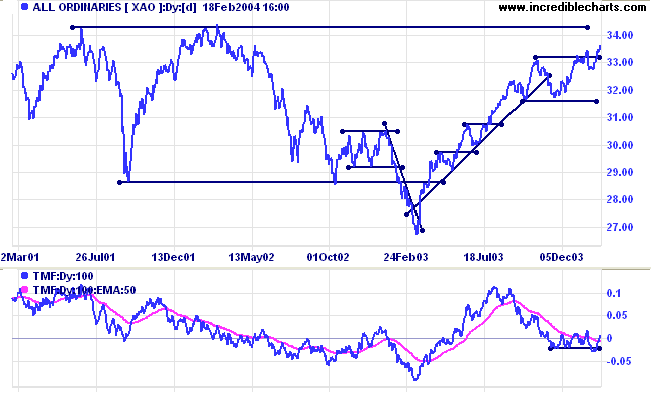
The primary trend is up. Resistance is at the
2001 and 2002 highs of 3425 and 3440.
Support is at 3160.
Support is at 3160.
Low volume and volatility
All too often our attention is captured by wide-ranging days with big volume, normally indicating either a strong trend or a reversal, depending on the position of the open and close. Reversal days are covered in a fair amount of depth in the Trading Guide but the most important signals can often be found in insignificant-looking bars: narrow range days.
How do we identify narrow range days? Jack Schwager introduces a simple Volatility Ratio in his book Schwager on Futures. It compares each day's true range to the 14-day moving average (of true range). High readings are wide-ranging days and low readings indicate days with a narrow range. I find this a very useful tool and often include it in my Stock Screens.
| Before you use an indicator, study it carefully. Examine the construction and make sure that you understand the reasoning. Never use an indicator without testing it extensively on historical data. There are a number of programs that offer automated back-testing but I am more comfortable working manually through historical charts. Most historical data is not adjusted for dividends, for example; so some automated results may be misleading. |
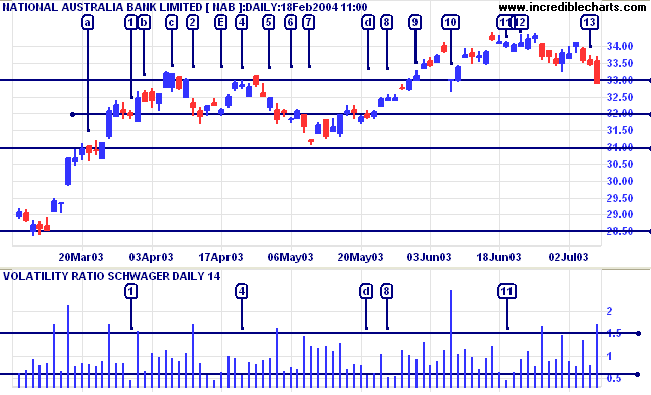
Schwager normally uses an upper reading of 2.0
but I find 1.5 more suited to high volume stocks like NAB. I have
treated days with a VR above 1.5 as wide-ranging days and below
0.6 as narrow range days. Days [1] [4] [8] and [11] are good
examples. Ignore [E] as this precedes the Easter weekend.
Compare these narrow days to the volume chart. Narrow days with strong volume are the same as over-square bars on the equivolume chart, signaling resistance.
[1] displays really big volume and acts like a compressed spring. The next day has a wide range when the spring is released.
[4] shows similar volume, signaling resistance. There is a false break above resistance at 33.00 two days later, followed by a strong downward move.
[8] on the other hand, has low volume; a bullish sign during a consolidation in an up-trend.
[11] is not followed by a wide-ranging day but signals a change in the underlying forces. The subsequent attempt to take out the high fails on low volume, commencing a strong down-trend.
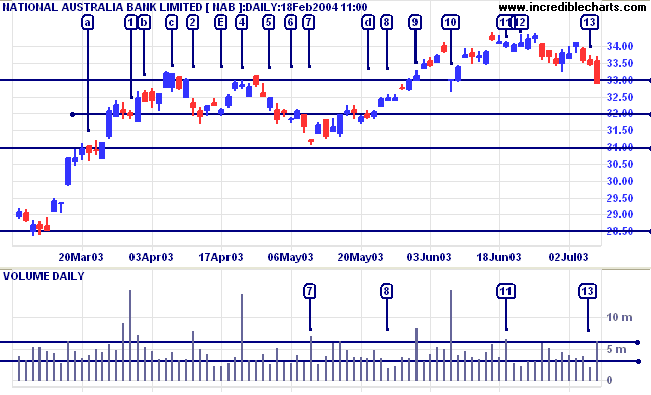
[10] is the ex-date for an 80 cent dividend,
introducing large volume and volatility. Remember, the VR
measures true range which includes gaps as at [10].
More on narrow ranging days tomorrow: How to combine them with Relative Strength and Twiggs Money Flow.
More on narrow ranging days tomorrow: How to combine them with Relative Strength and Twiggs Money Flow.
About
the Trading Diary has been expanded to offer further
assistance to readers, including directions on how to search the
archives.
Colin Twiggs
What we obtain too cheap, we esteem too lightly;
it is dearness only that gives everything its value.
~ Thomas Paine.
it is dearness only that gives everything its value.
~ Thomas Paine.
Stock Screens: Suggestions
| We will be revising the Stock Screens over the next few weeks. Many readers have already offered suggestions for improvements, but if you have any further requests, please email Support, with Stock Screen Suggestions in the subject line. |
Back Issues
You can now view back issues at the Daily Trading Diary Archives.
You can now view back issues at the Daily Trading Diary Archives.
Back Issues
Access the Trading Diary Archives.

Author: Colin Twiggs is a former investment banker with almost 40 years of experience in financial markets. He co-founded Incredible Charts and writes the popular Trading Diary and Patient Investor newsletters.
Using a top-down approach, Colin identifies key macro trends in the global economy before evaluating selected opportunities using a combination of fundamental and technical analysis.
Focusing on interest rates and financial market liquidity as primary drivers of the economic cycle, he warned of the 2008/2009 and 2020 bear markets well ahead of actual events.
He founded PVT Capital (AFSL No. 546090) in May 2023, which offers investment strategy and advice to wholesale clients.