|
We have received about 300 responses so
far. I will evaluate the survey results over the
weekend. If you have not yet completed the survey, please assist us by replying to this email and answering the questions below. Highlight answers in red or with an asterisk*.
Thanks for all your comments and suggestions. Colin Twiggs |
Trading Diary
February 12, 2004
USA
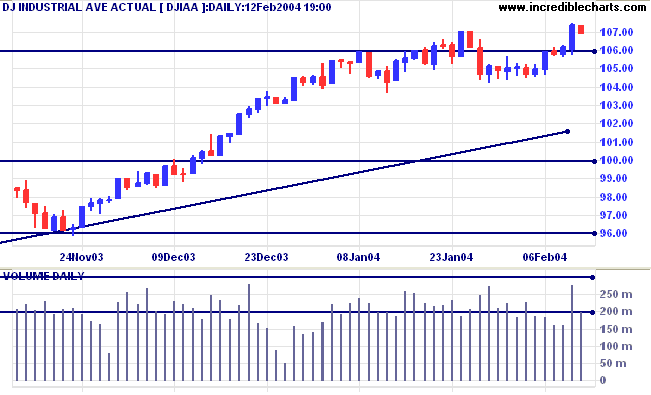
The intermediate trend is up.
The primary trend is up. A fall below support at 9600 will signal reversal.
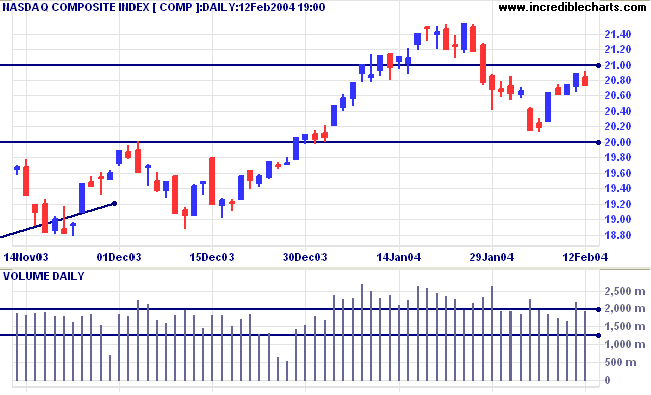
The intermediate trend is uncertain.
The primary trend is up. A fall below support at 1640 will signal reversal.
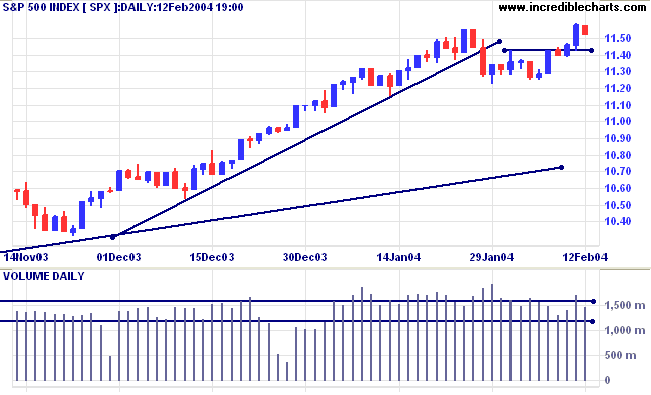
The intermediate trend is up. The next resistance level is at 1175. A fall below the recent low of 1122 would be bearish.
Intermediate: Bullish above 1122.
Long-term: Bullish above 1000.
New unemployment claims rose to 363,000 from 357,000 the previous week. (more)
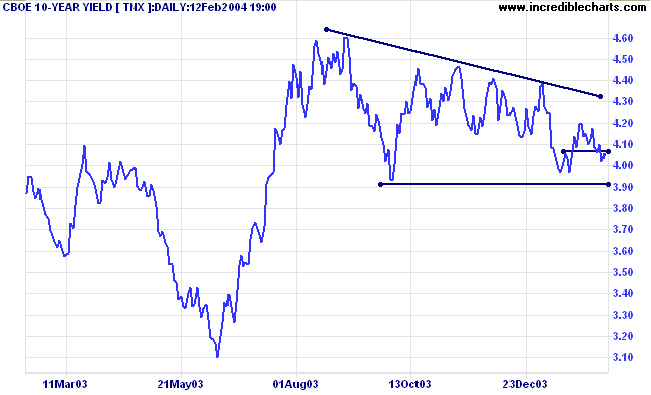
The yield on 10-year treasury notes retraced about half the previous day's fall, closing at 4.058%.
The intermediate trend is down.
The primary trend is up. A close below 3.93% will signal reversal.
New York (16.43): Spot gold rallied to $412.60.
The intermediate trend is uncertain. We may still see another test of support at 400.
The primary trend is up.
The intermediate trend is uncertain. A rise above resistance at 3350 would be bullish; as would a retracement that respects the 3320 support level. A fall below 3266 would signal the start of a down-trend.
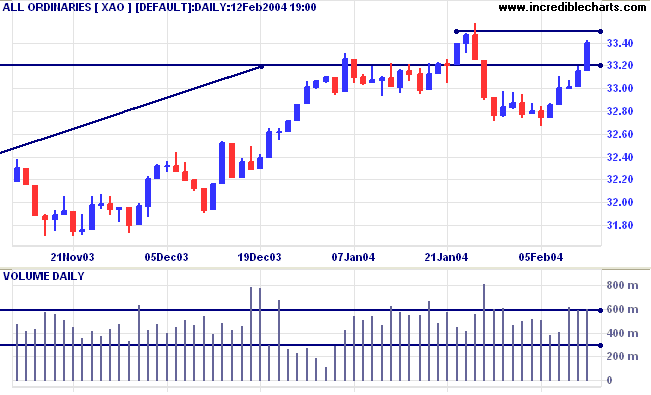
The primary trend is up. A fall below 3160 (the October 1 low) would signal reversal.
Intermediate term: Bullish above 3350. Bearish below 3160.
Long-term: Bearish below 3160.
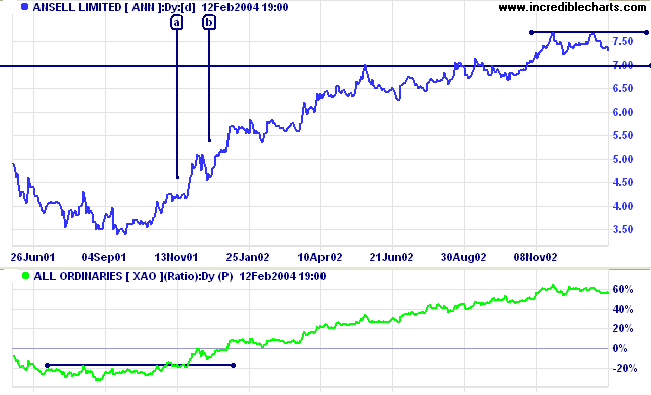
ANN has been trending upwards since testing support at 5.00 in early 2003. Twiggs Money Flow has again turned up above zero, signaling accumulation, while price is now approaching resistance at 7.00.
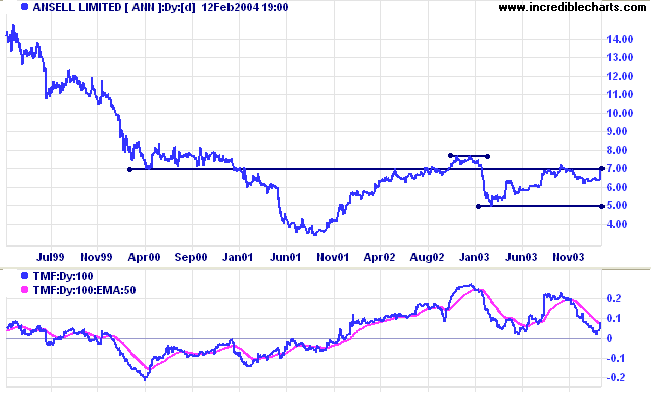
Both of the above signals occurred with Twiggs Money Flow above its signal line, a further bullish sign.
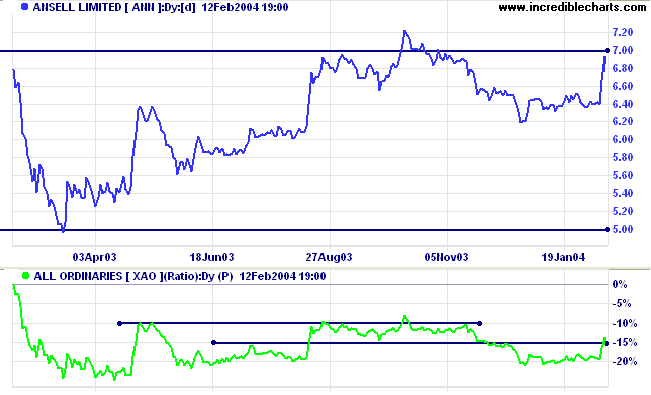
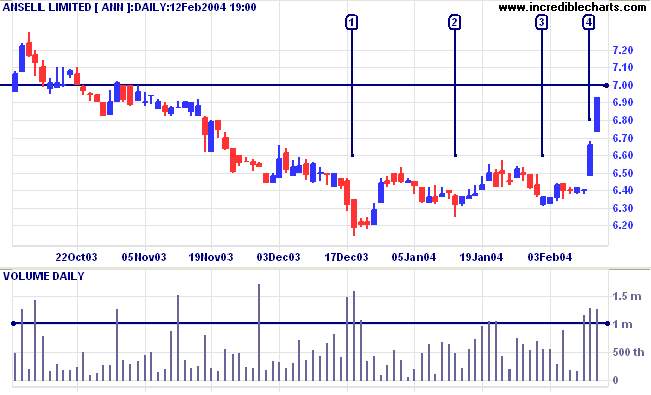
We can see a healthy shake-out at [1] with strong downward bars and big volume. A trick I learned from Bill McLaren is to draw an arbitrary line on the volume chart to separate large volume from regular volume - it helps one focus on unusual activity. Note the lower volume on the lows at [2] and [3], signaling fading selling pressure, and the real dry-up in volume and volatility before the gap up at [4]. Strong upward bars, gaps and large volume at [4] signals buyers "climbing over each other to get in". Be careful, this kind of activity can exhaust buyers energy and is often observed in blow-off spikes. Expect a pull-back or consolidation at resistance at 7.00.
~ Peter Drucker.
Some members have difficulty setting up RS for stocks.
(1) Open Price Ratio in the Indicator Panel (after opening any stock chart);
(2) Select either the All Ords or ASX 200 index for comparison;
(3) Select Daily and Project in the center panel;
(4) Save [>] your settings.
You can now view back issues at the Daily Trading Diary Archives.
Back Issues

Author: Colin Twiggs is a former investment banker with almost 40 years of experience in financial markets. He co-founded Incredible Charts and writes the popular Trading Diary and Patient Investor newsletters.
Using a top-down approach, Colin identifies key macro trends in the global economy before evaluating selected opportunities using a combination of fundamental and technical analysis.
Focusing on interest rates and financial market liquidity as primary drivers of the economic cycle, he warned of the 2008/2009 and 2020 bear markets well ahead of actual events.
He founded PVT Capital (AFSL No. 546090) in May 2023, which offers investment strategy and advice to wholesale clients.