A Quick Survey
Thank you for the excellent response so
far. If you have not yet completed the survey, please assist us by replying to this email and answering the questions below. Highlight answers in red or with an asterisk*.
Your feedback will be invaluable.
Thanks |
Trading Diary
February 11, 2004
These extracts from my daily trading diary are for educational
purposes and should not be interpreted as investment advice. Full
terms and conditions can be found at Terms
of Use .
USA
The market responded well to Alan Greenspan's
positive view of the US economy and his statement that the Fed
would be "patient" about raising interest
rates.(more)
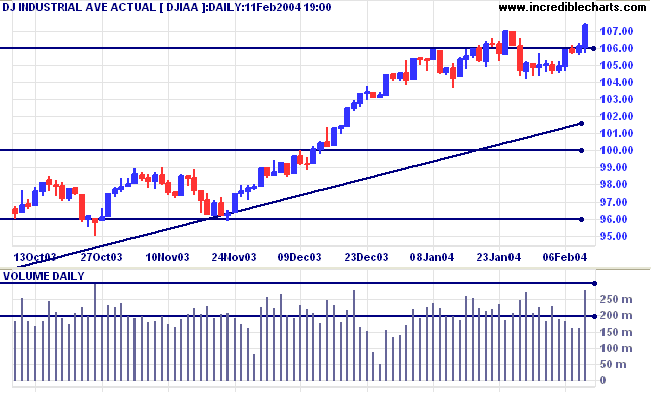
The Dow Industrial Average rallied through resistance at 10600,
making a new 2-year high on higher volume. A pull-back that
respects the new 10600 support level would be a bullish
sign.
The intermediate trend is up. Overhead resistance is at 11300 to 11350.
The primary trend is up. A fall below support at 9600 would signal reversal.
The intermediate trend is up. Overhead resistance is at 11300 to 11350.
The primary trend is up. A fall below support at 9600 would signal reversal.
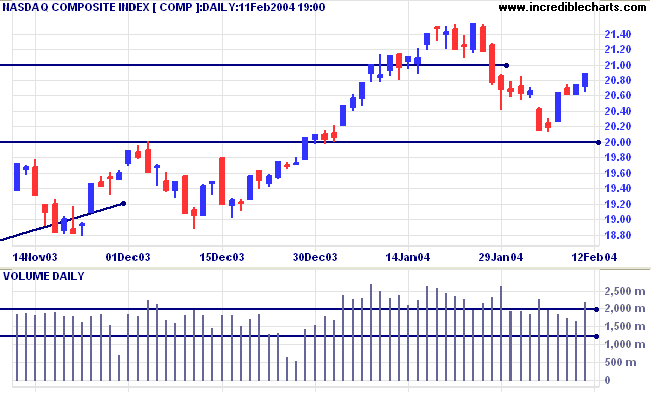
The Nasdaq Composite rallied to 2089 on strong
volume.
The intermediate trend is uncertain after the upward break. Resistance is at 2153; support at 2000.
The primary trend is up. A fall below support at 1640 will signal reversal.
The intermediate trend is uncertain after the upward break. Resistance is at 2153; support at 2000.
The primary trend is up. A fall below support at 1640 will signal reversal.
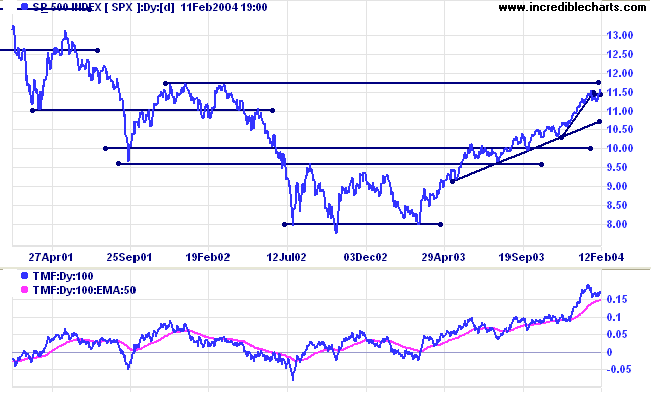
The S&P 500 also closed at a new high of 1157, on strong
volume.
The intermediate trend is up, but overhead resistance is close by at 1175.
Short-term: Bullish if the S&P500 is above 1150. Bearish below the recent low of 1122.
The intermediate trend is up, but overhead resistance is close by at 1175.
Short-term: Bullish if the S&P500 is above 1150. Bearish below the recent low of 1122.
The primary trend is up. A fall below 960 would signal
reversal.
Intermediate: Bullish above 1122.
Long-term: Bullish above 1000.
Intermediate: Bullish above 1122.
Long-term: Bullish above 1000.
The Chartcraft NYSE Bullish % Indicator is up at
84.97%.
Treasury yields
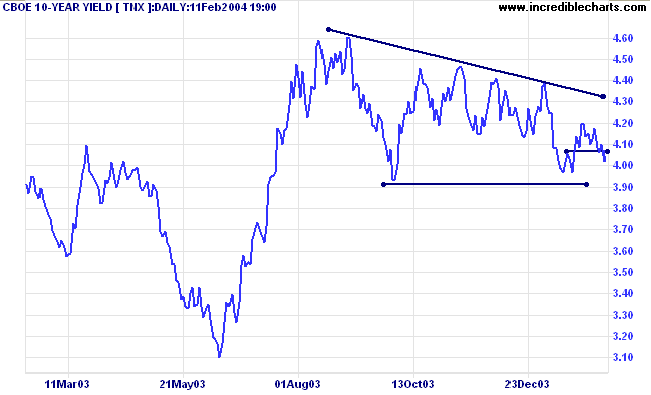
Following the Fed Chairman's comments, the yield on 10-year treasury notes fell to 4.02%, continuing the intermediate down-trend.
The primary trend is up. A close below 3.93% would signal reversal.
Following the Fed Chairman's comments, the yield on 10-year treasury notes fell to 4.02%, continuing the intermediate down-trend.
The primary trend is up. A close below 3.93% would signal reversal.
Gold
New York (21.11): Spot gold is up at $411.70.
The intermediate trend is still down. Support is at 400.
The primary trend is up.
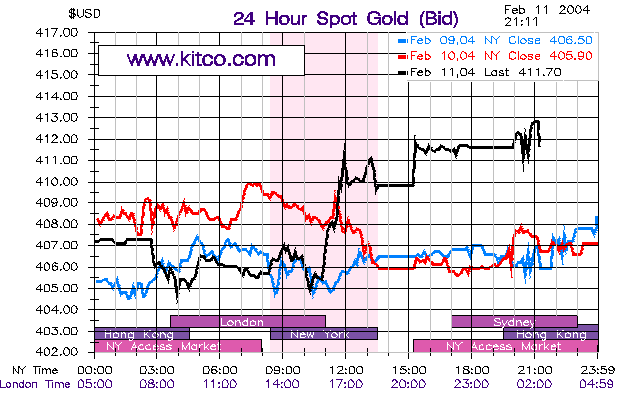
New York (21.11): Spot gold is up at $411.70.
The intermediate trend is still down. Support is at 400.
The primary trend is up.
ASX Australia
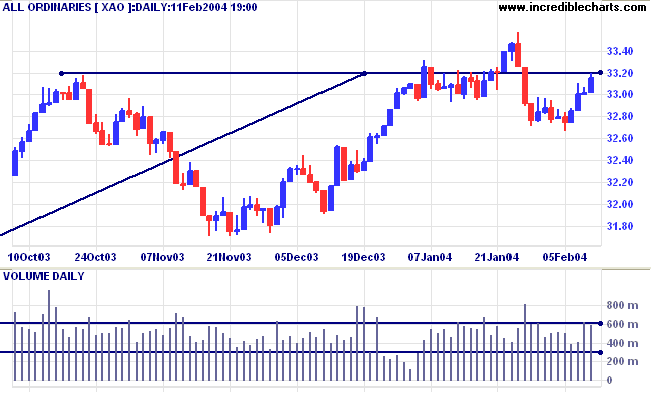
The All Ordinaries rallied to test resistance at 3320 before
retreating slightly to close at 3315. High volume indicates
selling pressure. The intermediate trend is uncertain. A
follow-through above 3320 will be bullish. A fall below 3266
would signal the start of a down-trend.
Twiggs Money Flow (100) is at its 3-month support level, but
still appears weak.
The primary trend is up. A fall below 3160 (the October 1 low) would signal reversal.
Intermediate term: Bullish above 3350. Bearish below 3160.
Long-term: Bearish below 3160.
The primary trend is up. A fall below 3160 (the October 1 low) would signal reversal.
Intermediate term: Bullish above 3350. Bearish below 3160.
Long-term: Bearish below 3160.
Record Investments [RCD]
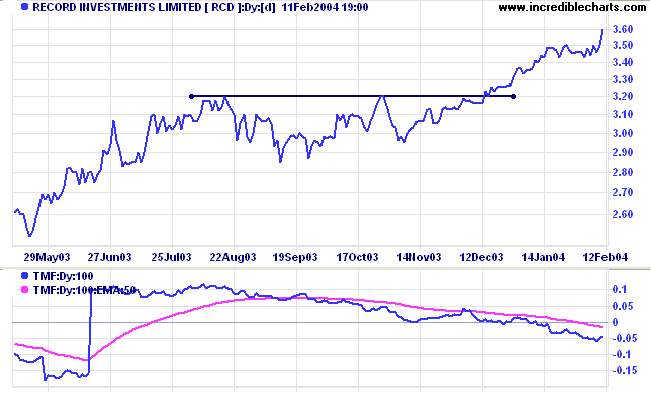
One of our readers pointed this out: RCD has rallied above a mid-point consolidation but Twiggs Money Flow continues to fall, displaying a strong bearish divergence.
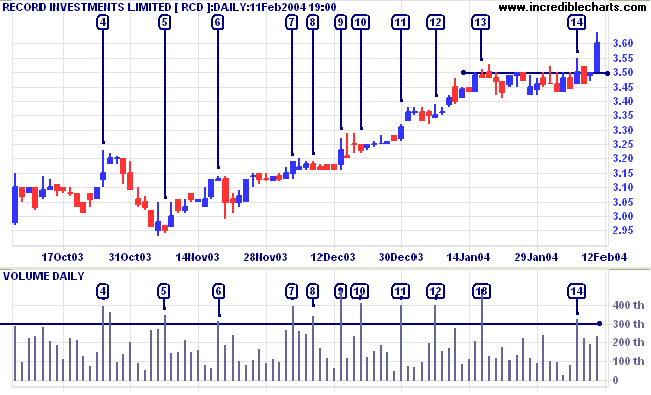
I have highlighted large volume days over the last 4 months,
selecting an arbitrary level of 300,000. All but two of the days,
[7] and [11], show signs of distribution. Weak closes can be
explained by a seller with a large parcel of stock selling into
rallies: at [4], [9], [12] and [14]. This would disguise their
presence. Narrow ranges after a strong upward day tell a similar
tale: the inside day after [4], and at [6], [8] and [13].
Selling has been very controlled throughout, with only two days,
at [5] and [10], where selling continued after the rally ended.
The latest bar seems stronger and a pull-back that respects
support at 3.50 will be a bullish sign. A fall below the low of
3.41 would be bearish. I would not touch this unless there is a
radical improvement in TMF - it would be foolhardy to ignore a
key indicator.
About
the Trading Diary has been expanded to offer further
assistance to readers, including directions on how to search the
archives.
Colin Twiggs
Anyone who stops learning is old, whether at twenty or
eighty.
Anyone who keeps learning stays young.
The greatest thing in life is to keep your mind young.
~ Henry Ford.
Anyone who keeps learning stays young.
The greatest thing in life is to keep your mind young.
~ Henry Ford.
Please remember to complete the Quick
Survey.
We will appreciate your honesty in highlighting areas that require attention.
Thanks
We will appreciate your honesty in highlighting areas that require attention.
Thanks
Back Issues
You can now view back issues at the Daily Trading Diary Archives.
Back Issues
Access the Trading Diary Archives.