|
If you install a spam filter on your computer, please
remember to create permission for
*incrediblecharts.com -- so that you continue to
receive the Trading Diary and Chart Forum notices. The newsletter can also be viewed at https://tradingdiary.incrediblecharts.com/trading_diary.php |
Trading Diary
February 2, 2004
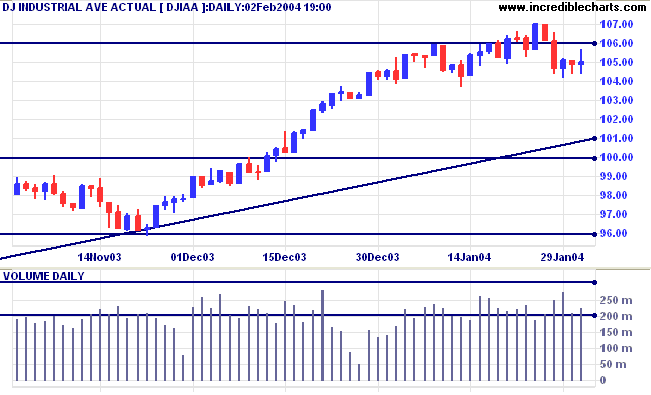
The primary trend is up. A fall below support at 9600 would signal reversal.
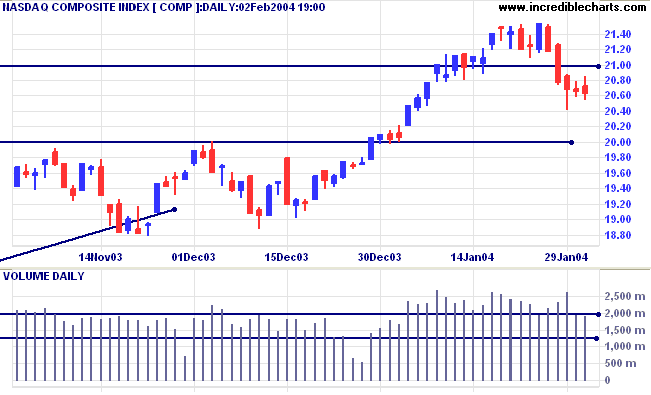
The intermediate trend is uncertain. Initial support is at 2000, resistance at 2300. A fall below Thursday's low of 2041 will signal the start of a down-trend.
The primary trend is up. A fall below support at 1640 will signal reversal.
The intermediate trend is up, with resistance overhead at 1175.
Short-term: Bullish if the S&P500 is above 1155. Bearish below Thursday's low of 1122.
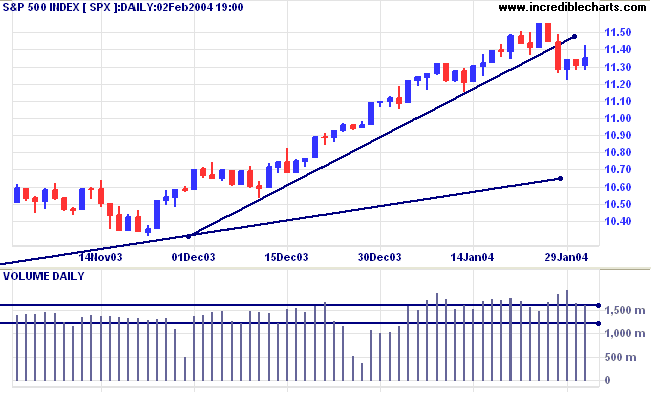
Twiggs Money Flow (100) continues to signal accumulation.
Intermediate: Bullish above 1155.
Long-term: Bullish above 1000.
The ISM manufacturing index recorded a slight rise to 63.6 in January. A reading above 50 signals expansion. (more)
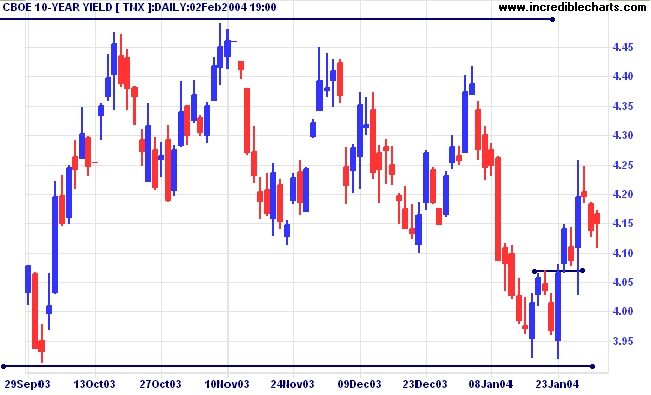
The yield on 10-year treasury notes eased higher to 4.151%. The weak close is a bullish sign.
The intermediate trend is up and likely to re-test resistance levels at 4.4% to 4.5%.
The primary trend is up. A close below the September low of 3.93% would signal reversal.
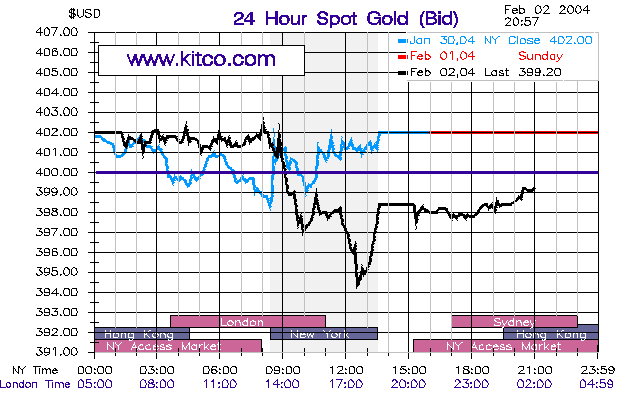
New York (13.00): Spot gold plunged to 394 before recovering to $399.20, just below resistance at 400.
The intermediate trend is down.
The primary trend is up.
The intermediate trend is uncertain. A fall below 3271 would signal a down-trend, with a likely test of support at 3160.
Short-term: Bullish above 3350. Bearish below 3271 (Thursday's low).
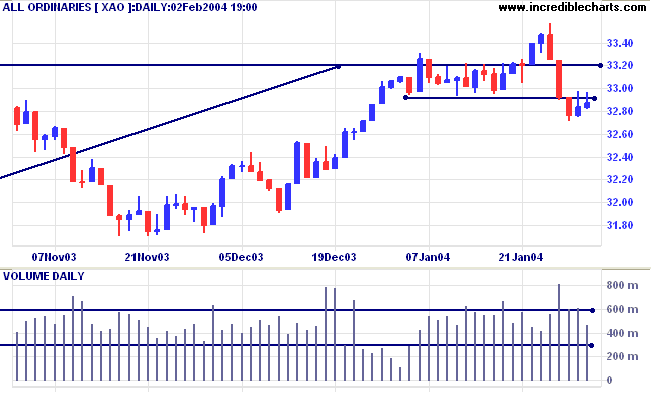
The primary trend is up. A fall below 3160 (the October 1 low) would signal reversal.
Intermediate term: Bullish above 3350. Bearish below 3160.
Long-term: Bearish below 3160.
there is no shame in being wrong, only in failing to correct our mistakes.
~ George Soros
Dow Jones Industrial Average and S&P
500 have been added to the list of Indexes.
If you screen US stocks you can now restrict your search to
components of either of these indexes.
You can now view back issues at the Daily Trading Diary Archives.
Back Issues

Author: Colin Twiggs is a former investment banker with almost 40 years of experience in financial markets. He co-founded Incredible Charts and writes the popular Trading Diary and Patient Investor newsletters.
Using a top-down approach, Colin identifies key macro trends in the global economy before evaluating selected opportunities using a combination of fundamental and technical analysis.
Focusing on interest rates and financial market liquidity as primary drivers of the economic cycle, he warned of the 2008/2009 and 2020 bear markets well ahead of actual events.
He founded PVT Capital (AFSL No. 546090) in May 2023, which offers investment strategy and advice to wholesale clients.