Stock Screening: Time
Stamps
Stock Screen returns have a time stamp in the heading, showing the latest update.
Stock Screen returns have a time stamp in the heading, showing the latest update.
Always check the time stamp to ensure that
you have the latest data.
Trading Diary
January 15, 2004
These extracts from my daily trading diary are
for educational purposes and should not be interpreted as
investment advice. Full terms and conditions can be found at
Terms
of Use .
USA
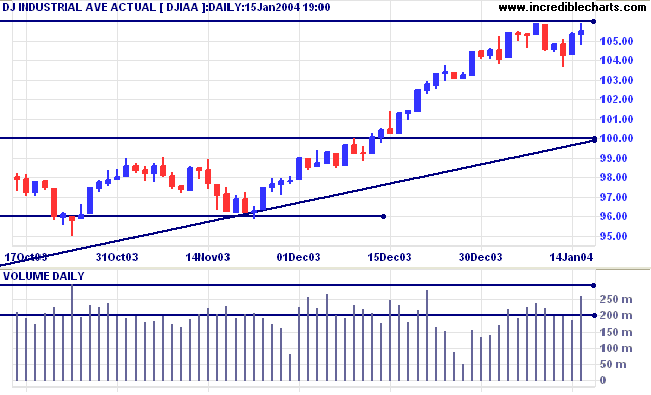
The Dow Industrial Average rallied to test
resistance at 10600, but then retreated to close at 10553. Higher
volume and a weak close signal selling pressure.
The intermediate trend is up. Consolidation in a narrow range below major resistance is a bullish sign (during an up-trend). A fall below 10367 would be bearish, signaling a re-test of support levels.
The primary trend is up. A fall below support at 9600 will signal reversal.
The intermediate trend is up. Consolidation in a narrow range below major resistance is a bullish sign (during an up-trend). A fall below 10367 would be bearish, signaling a re-test of support levels.
The primary trend is up. A fall below support at 9600 will signal reversal.
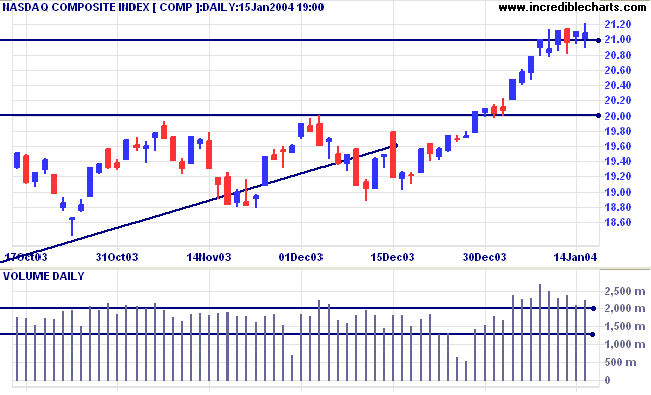
The Nasdaq Composite closed at 2109,
consolidating at the upper border of resistance, a bullish sign
(during an up-trend). Strong volume and a narrow body signal
increased opposition from buyers and sellers.
The intermediate trend is up.
The primary trend is up. A fall below support at 1640 will signal reversal.
The intermediate trend is up.
The primary trend is up. A fall below support at 1640 will signal reversal.
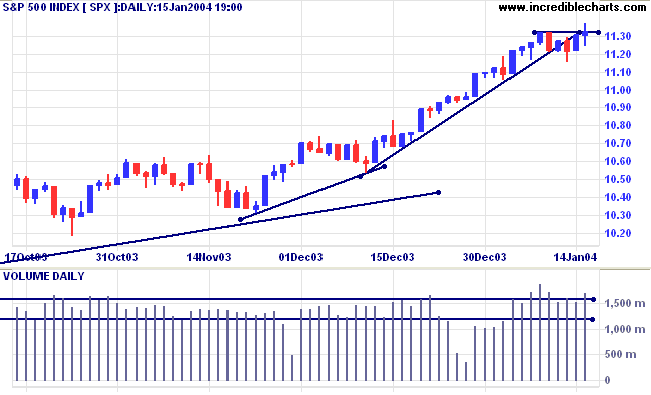
The S&P 500 encountered resistance at the
recent high, closing at 1132 on strong volume.
The intermediate trend is up. The next resistance level is at 1175. A fall below 1115 (Tuesday's low) would be bearish.
Short-term: Bullish if the S&P500 is above the high of 1132 (last Thursday's high). Bearish below 1115.
The intermediate trend is up. The next resistance level is at 1175. A fall below 1115 (Tuesday's low) would be bearish.
Short-term: Bullish if the S&P500 is above the high of 1132 (last Thursday's high). Bearish below 1115.
The primary trend is up. A fall below 1000 will
signal reversal.
Intermediate: Bullish above 1115.
Long-term: Bullish above 1000.
Intermediate: Bullish above 1115.
Long-term: Bullish above 1000.
The Chartcraft NYSE Bullish % Indicator fell to
85.08% (January 15).
$58 billion bank deal
JP Morgan Chase agrees to buy Bank One for $58 billion. (more)
JP Morgan Chase agrees to buy Bank One for $58 billion. (more)
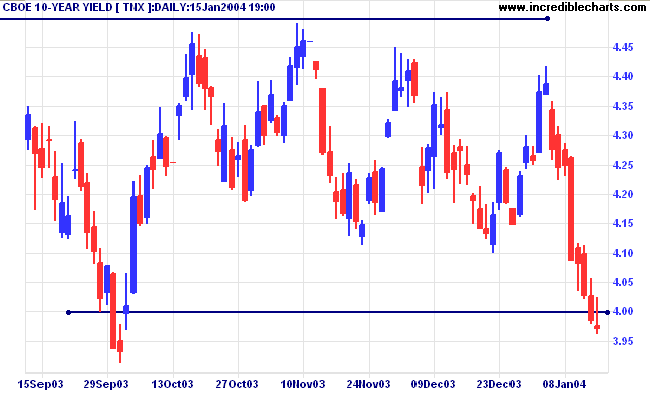
Treasury yields
The yield on 10-year treasury notes continues to fall, closing at 3.97%, a bearish sign.
The intermediate trend is down.
The primary trend is up. A close below 3.93% will signal reversal - a bearish sign for US stocks.
The yield on 10-year treasury notes continues to fall, closing at 3.97%, a bearish sign.
The intermediate trend is down.
The primary trend is up. A close below 3.93% will signal reversal - a bearish sign for US stocks.
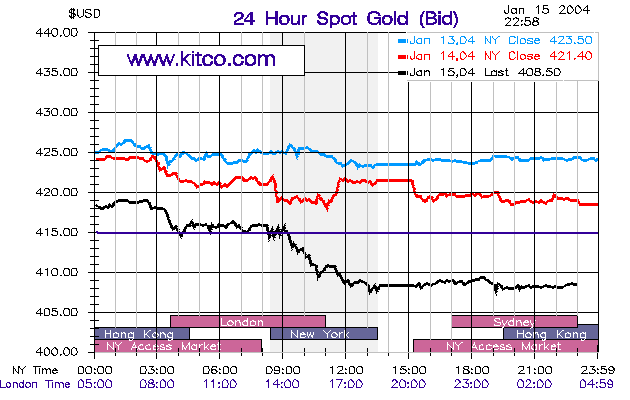
Gold
New York (16.43): Spot gold fell sharply to $408.50, below support at 415.
The intermediate trend is up. We are likely to see a test of support at 400.
The primary trend is up.
New York (16.43): Spot gold fell sharply to $408.50, below support at 415.
The intermediate trend is up. We are likely to see a test of support at 400.
The primary trend is up.
ASX Australia
The All Ordinaries continued to consolidate between 3320 and
3293, testing resistance before closing back at 3312. Lower
volume and a weak close signal a lack of enthusiasm from buyers.
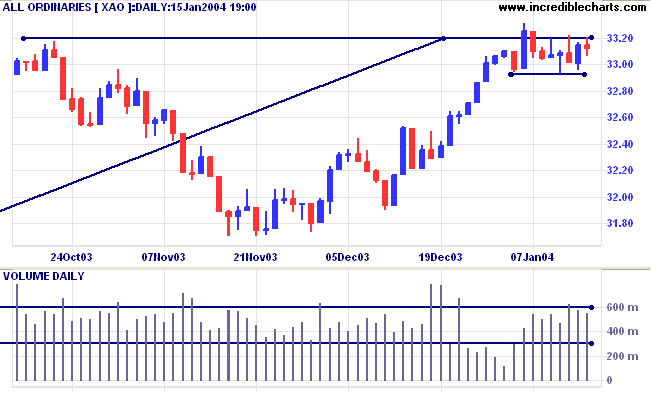
The intermediate trend is up. The consolidation pattern, in a
narrow range below resistance, is a bullish sign. A fall below
3293 would signal a re-test of support at 3160.
MACD (26,12,9) is above its signal line; Slow Stochastic (20,3,3) has whipsawed above.
Short-term: Bullish above 3320. Bearish below 3293.
MACD (26,12,9) is above its signal line; Slow Stochastic (20,3,3) has whipsawed above.
Short-term: Bullish above 3320. Bearish below 3293.
In the longer-term, the All Ords has consolidated between 3160
and 3320 after a fast up-trend. A break through resistance will
signal a re-test of major resistance at 3425 to 3440.
The primary trend is up but will reverse if there is a fall below support at 3160 (Oct 1 low). Twiggs Money Flow (100) has leveled out but is still bearish after a large divergence.
Intermediate term: Bullish above 3293.
Long-term: Bearish below 3160.
The primary trend is up but will reverse if there is a fall below support at 3160 (Oct 1 low). Twiggs Money Flow (100) has leveled out but is still bearish after a large divergence.
Intermediate term: Bullish above 3293.
Long-term: Bearish below 3160.
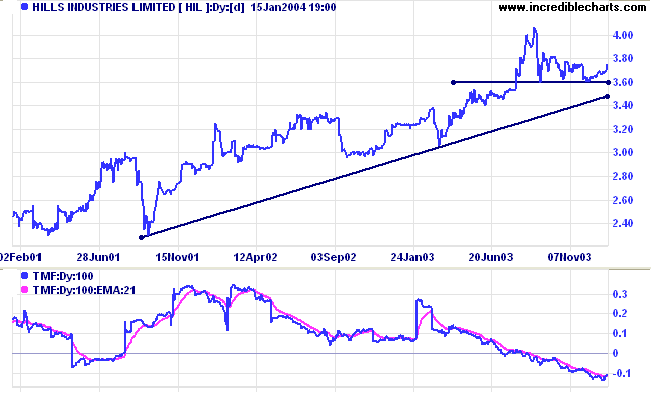
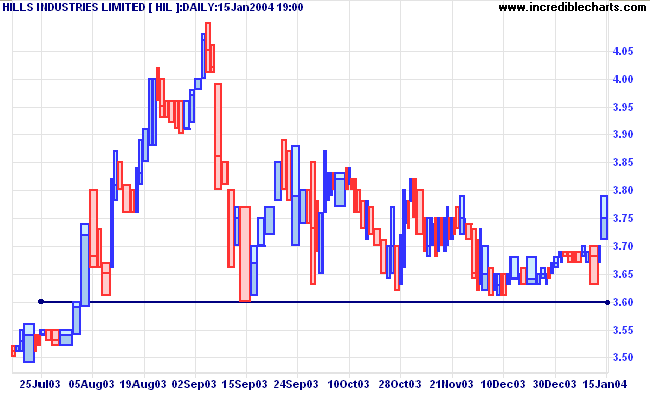
Hills Industries [HIL]
HIL has formed a consolidation pattern, roughly in the shape of a bearish descending triangle, after a lengthy up-trend. Twiggs Money Flow (100) is falling, signaling strong distribution.
HIL has formed a consolidation pattern, roughly in the shape of a bearish descending triangle, after a lengthy up-trend. Twiggs Money Flow (100) is falling, signaling strong distribution.
Support has formed at 3.60. Relative Strength (price ratio: xao)
is creeping lower but has yet to make a decisive break below the
previous support level.
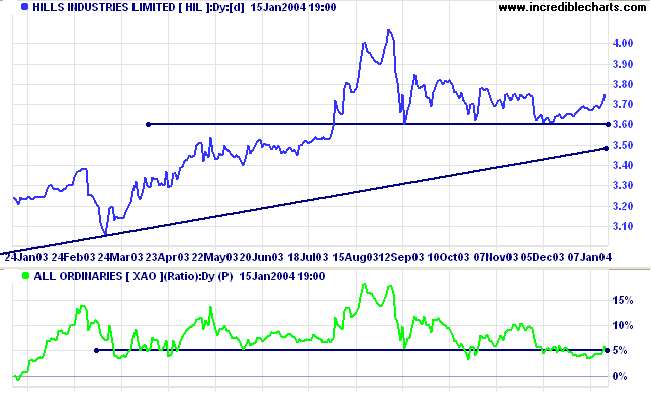
A break below 3.60 would be bearish. A subsequent peak below 3.60
would be a strong bear signal.
About
the Trading Diary has been expanded to offer further
assistance to readers, including directions on how to search the
archives.
Colin Twiggs
.....my whole life has always been down to
the fact that when you have a setback, you don't call that a
loss.
"Lose" means when you don't get back up.
A "setback" means that, hey, something happened, something that you did wrong and then you're corrected.
Now you mend it back together. Now it's stronger than it was the first time,
and you know you're going through here because of the experience that you're gonna have behind you.
~ Evander Holyfield
(talking about day trading of course)
Incredible Charts: Latest Plans
| In response to a number of requests, subscriptions for the Daily Trading Diary and Incredible Charts Premium Data will be offered separately, at $180 (AUD) each. The combined subscription remains at $270 (AUD). Some development work is required before the new subscription page will be ready, so this will not happen immediately. |
Back Issues
You can now view back issues at the Daily Trading Diary Archives.
You can now view back issues at the Daily Trading Diary Archives.
Back Issues
Access the Trading Diary Archives.

Author: Colin Twiggs is a former investment banker with almost 40 years of experience in financial markets. He co-founded Incredible Charts and writes the popular Trading Diary and Patient Investor newsletters.
Using a top-down approach, Colin identifies key macro trends in the global economy before evaluating selected opportunities using a combination of fundamental and technical analysis.
Focusing on interest rates and financial market liquidity as primary drivers of the economic cycle, he warned of the 2008/2009 and 2020 bear markets well ahead of actual events.
He founded PVT Capital (AFSL No. 546090) in May 2023, which offers investment strategy and advice to wholesale clients.