The problem with stock screening watchlists has been fixed.
It is advisable to keep the following stocks in separate watchlists:
|
Trading Diary
January 13, 2004
A follow-through like this normally heralds a change in the intermediate trend and we are likely to see a re-test of support at 10000.
The primary trend is up. A fall below support at 9600 will signal reversal.
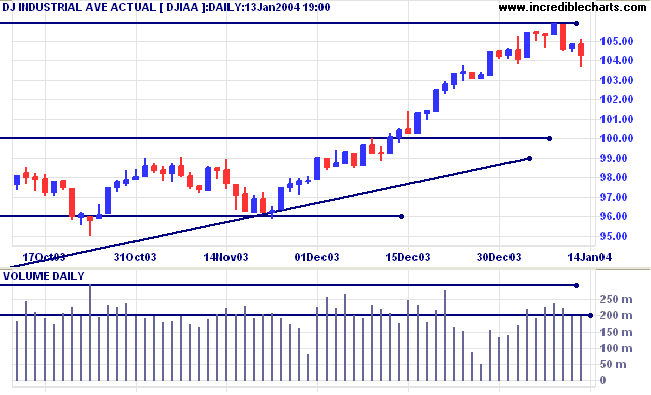
The intermediate trend is up.
The primary trend is up. A fall below support at 1640 will signal reversal.
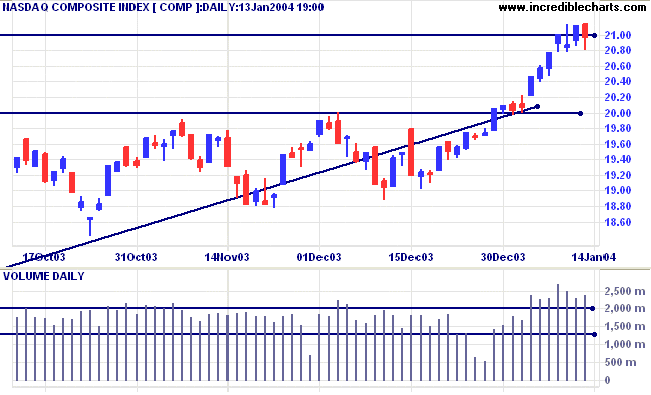
The intermediate trend is up.
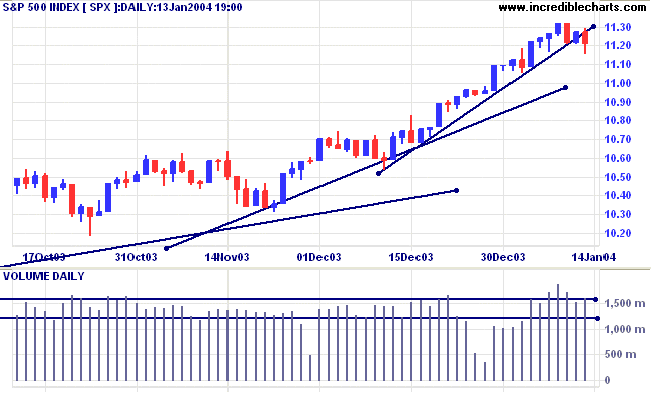
Short-term: Bullish if the S&P500 is above the high of 1132 (Thursday's high). Bearish below 1120 (Monday's low).
Intermediate: Bullish above 1120.
Long-term: Bullish above 1000.
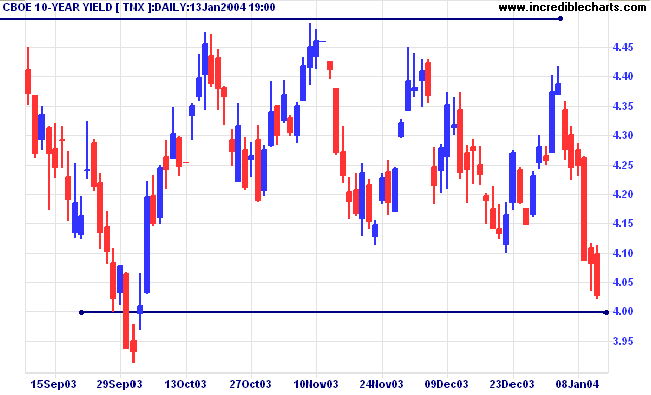
The yield on 10-year treasury notes is down at 4.02%.
The intermediate trend is down.
The primary trend is up. A close below 3.93% will signal reversal.
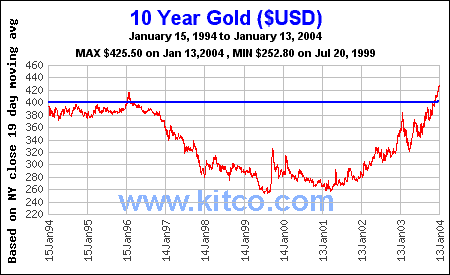
New York (00.45): Spot gold is up at $424.40.
The intermediate trend is up.
The primary trend is up. Expect support at 400 and 415.
MACD (26,12,9) is above its signal line; Slow Stochastic (20,3,3) is below.
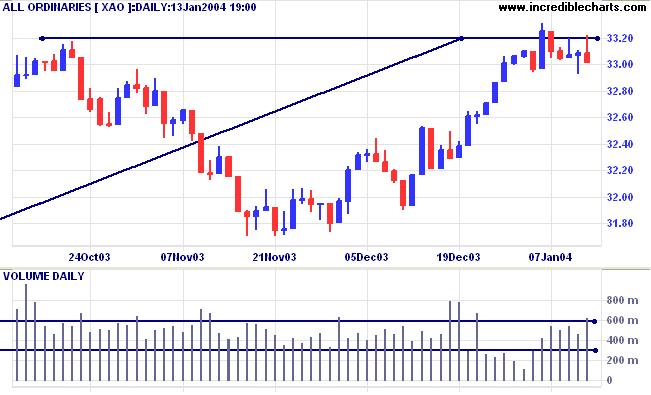
Short-term: Bullish above 3320. Bearish below 3293.
Intermediate term: Bullish above 3320. Bearish below 3160.
Long-term: Bearish below 3160.
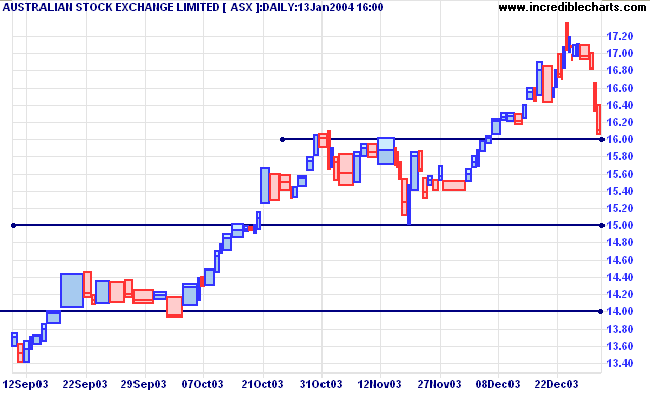
Last covered on November 11, 2003.
ASX has pulled back to test support at 16.00 after a fast up-trend following the break above resistance at 14.00. Twiggs Money Flow (100) has turned below the previous trough; a bearish sign.
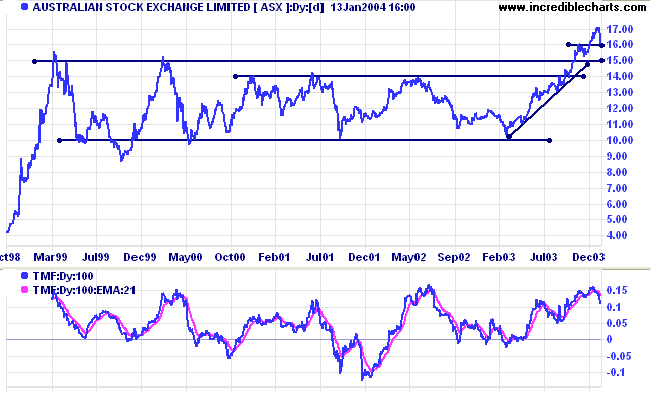
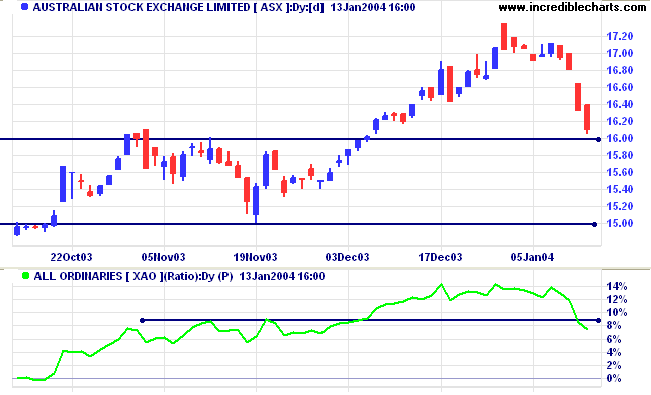
Judging by the speed of the correction, we may well see a re-test of the major support level at 15.00, presenting long-term bull opportunities if support holds.
the stock market is an expensive place to find out.
~ George Goodman.
| In response to a number of requests, subscriptions for the Daily Trading Diary and Incredible Charts Premium Data will be offered separately, at $180 (AUD) each. The combined subscription remains at $270 (AUD). Some development work is required before the new subscription page will be ready, so this will not happen immediately. |
You can now view back issues at the Daily Trading Diary Archives.
Back Issues

Author: Colin Twiggs is a former investment banker with almost 40 years of experience in financial markets. He co-founded Incredible Charts and writes the popular Trading Diary and Patient Investor newsletters.
Using a top-down approach, Colin identifies key macro trends in the global economy before evaluating selected opportunities using a combination of fundamental and technical analysis.
Focusing on interest rates and financial market liquidity as primary drivers of the economic cycle, he warned of the 2008/2009 and 2020 bear markets well ahead of actual events.
He founded PVT Capital (AFSL No. 546090) in May 2023, which offers investment strategy and advice to wholesale clients.