|
Your feedback and suggestions will be appreciated; at the Chart Forum.
Trading Diary
January 9, 2004
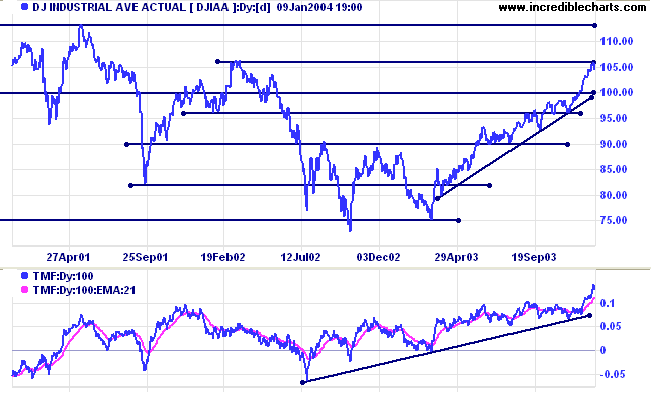
The fast intermediate up-trend is likely to either consolidate below resistance at 10600 (from the March 2002 peak) or correct back to the primary supporting trendline. Twiggs Money Flow (100) continues to signal strong accumulation.
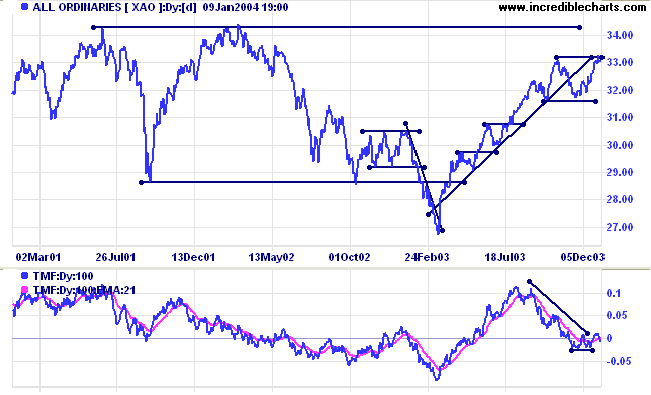
The primary trend is up. A fall below support at 9600 will signal reversal.
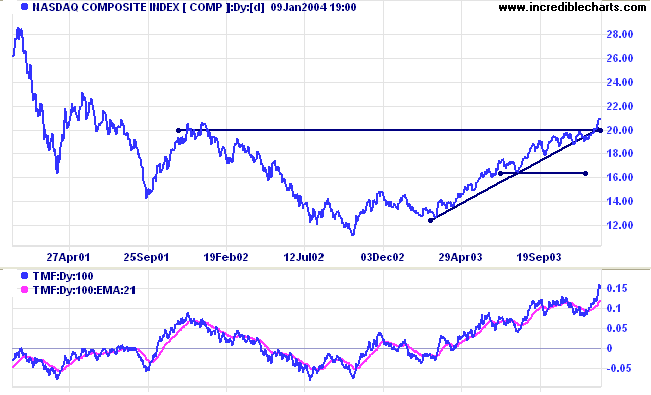
The intermediate trend is up. Support is at 2000 and resistance at 2100. A break above 2100 will be a strong bull signal.
Twiggs Money Flow (100) continues to signal strong accumulation.
The primary trend is up. A fall below support at 1640 will signal reversal.
The intermediate up-trend is accelerating. A fourth, steeper trendline is likely to signal a blow-off. Resistance at 1175 may, however, intervene.
Short-term: Bullish if the S&P500 is above Thursday's high of 1132.
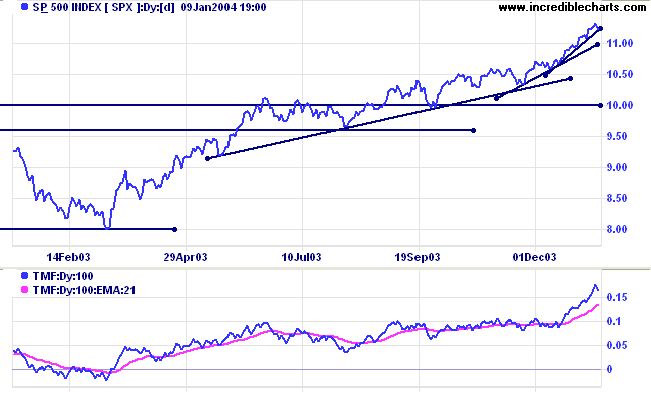
Intermediate: Bullish above 1070 (from December 1).
Long-term: Bullish above 1000.
The Daily Trading Diary analyzes market indexes and selected stocks on a daily basis.
|
To find out more - Click Here.
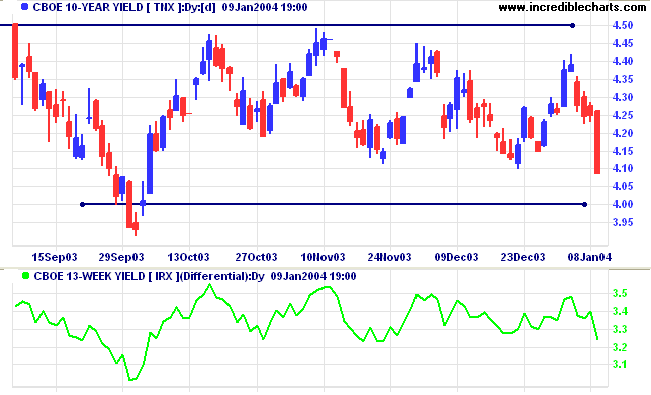
The yield on 10-year treasury notes plummeted to 4.086%.
The intermediate trend is down.
The primary trend is up. Price has been ranging between 4.0 and 4.5% and a fall below the September low of 3.93% will signal reversal.
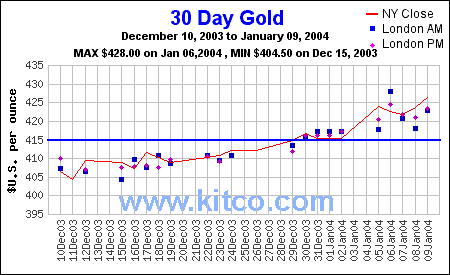
New York (13.30): Spot gold rallied to $426.20.
The intermediate trend is up.
The primary trend is up. Support is at 415 (the previous 10-year high).
Subscribe to Incredible Charts Premium
version with:
|
for only $270 (AUD)
annual subscription
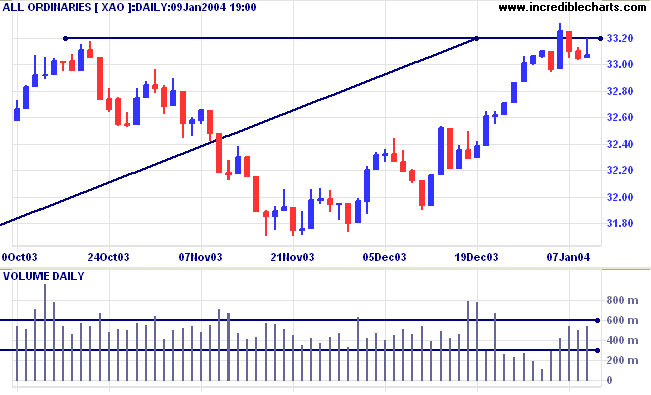
Short-term: Bullish above 3320. Bearish below 3293.
Intermediate term: Bullish above 3320. Bearish below 3160.
Long-term: Bearish below 3160.
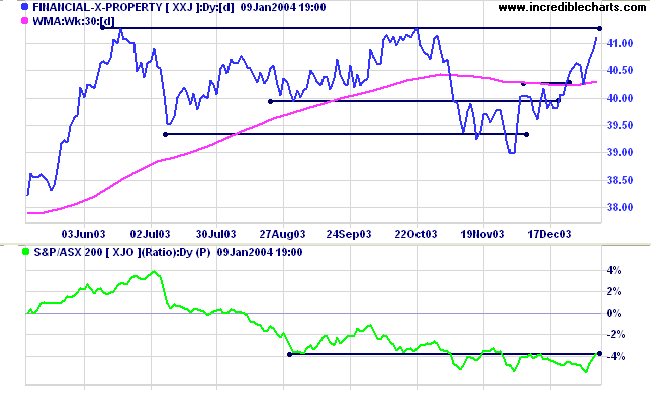
The 11 sectors (10 + Property) are in various market stages. Relative Strength (xjo) measures the performance of each sector relative to the overall index.
- Energy [XEJ] - stage 2 (RS is rising)
- Materials [XMJ] - stage 2 (RS is rising)
- Industrials [XNJ] - stage 2 (RS is rising)
- Consumer Discretionary [XDJ] - stage 3 (RS is falling)
- Consumer Staples [XSJ] - stage 2 (RS is level)
- Health Care [XHJ] - stage 1 (RS is falling)
- Property Trusts [XPJ] - stage 3 (RS is rising).
- Financial excl. Property [XXJ] - stage 4** (RS is level)
- Information Technology [XIJ] - stage 2 (RS is level)
- Telecom Services [XTJ] - stage 2 (RS is level)
- Utilities [XUJ] - stage 3 (RS is level)
A stock screen of the ASX 200 using % Price Move (1 month: +5%) increased to 62 stocks (compared to 131 on April 11, 2003; and 8 on March 14, 2003). Prominent sectors are:
- Oil & Gas Exploration & Production (7)
- Broadcasting & Cable TV (5)
- Banks (4)
- Diversified Metals & Mining (3)
- Diversified Commercial (3)
- Data Processing (3)
- Aluminum (2)
It is the highest form of self-respect
to admit mistakes and to make amends for them.
~ John (Jay) McCloy.
Stock Screens now display the date and time of the last update.
ASX data is updated twice daily:
- after the 4.00 p.m. market close; and
- after the 7.00 p.m. final update.
You can now view back issues at the Daily Trading Diary Archives.
Back Issues

Author: Colin Twiggs is a former investment banker with almost 40 years of experience in financial markets. He co-founded Incredible Charts and writes the popular Trading Diary and Patient Investor newsletters.
Using a top-down approach, Colin identifies key macro trends in the global economy before evaluating selected opportunities using a combination of fundamental and technical analysis.
Focusing on interest rates and financial market liquidity as primary drivers of the economic cycle, he warned of the 2008/2009 and 2020 bear markets well ahead of actual events.
He founded PVT Capital (AFSL No. 546090) in May 2023, which offers investment strategy and advice to wholesale clients.