Incredible Charts version 4.0.2.800
will be released this weekend.
Incredible Charts should automatically update when you connect to the server.
The new version offers adjusted end-of-day charts and stock screens
for ASX, NYSE, Nasdaq and Amex exchanges and US Indexes.
US sector allocations will be added later.
The stock screens and US stocks will be available on the free version
(Securities menu) until further notice.
Trading Diary
January 2, 2004
These extracts from my daily trading diary are
for educational purposes and should not be interpreted as
investment advice. Full terms and conditions can be found at
Terms
of Use .
USA
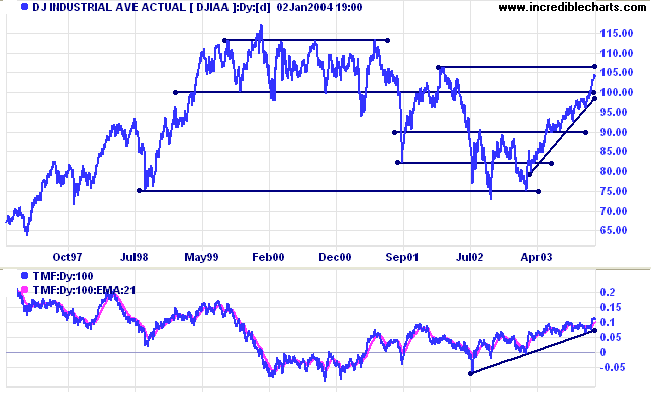
The Dow Industrial Average encountered resistance at 10500,
closing down at 10409.
The intermediate trend is up. Expect resistance at 10600, from the March 2002 peak.
The primary trend is up. A fall below support at 9000 will signal reversal.
The intermediate trend is up. Expect resistance at 10600, from the March 2002 peak.
The primary trend is up. A fall below support at 9000 will signal reversal.
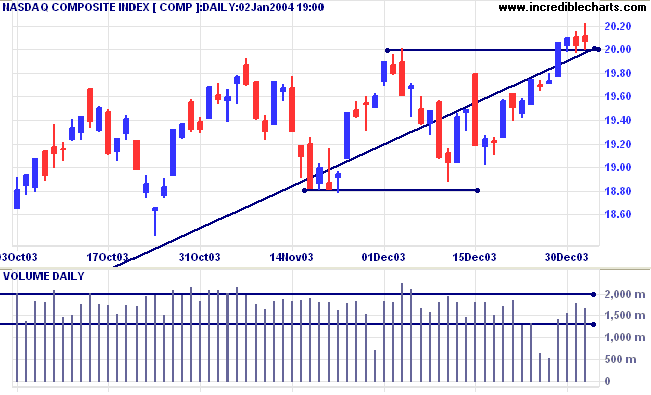
The Nasdaq Composite broke through resistance at 2000, but has
since failed to make further gains, closing at 2006.
Consolidation above the new support level is still a bullish
sign.
The intermediate trend is up.
The primary trend is up. A fall below support at 1640 will signal reversal.
The intermediate trend is up.
The primary trend is up. A fall below support at 1640 will signal reversal.
The S&P 500 closed the week at 1108, consolidating after a
strong surge above 1100.
The intermediate trend is up.
Short-term: Bullish if the S&P500 is above Monday's high of 1109. Bearish below 1106 (Tuesday's low).
The intermediate trend is up.
Short-term: Bullish if the S&P500 is above Monday's high of 1109. Bearish below 1106 (Tuesday's low).
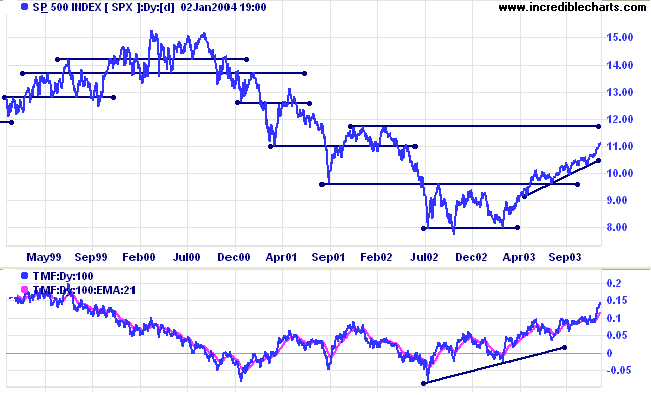
The primary trend is up. A fall below 960 will signal
reversal.
Intermediate: Bullish above 1109.
Long-term: Bullish above 960.
Intermediate: Bullish above 1109.
Long-term: Bullish above 960.
The Chartcraft NYSE Bullish % Indicator is at a
10-year high of 84.85% (January 2).
Manufacturing surge
The ISM manufacturing index posted a strong gain to 66.2, compared to 62.8 in November. (more)
The ISM manufacturing index posted a strong gain to 66.2, compared to 62.8 in November. (more)
Daily Trading Diary
The Daily Trading Diary will resume on January 5th 2004.
Treasury yields
The yield on 10-year treasury notes closed higher at 4.37%.
The intermediate trend is uncertain, with price ranging between 4.0 and 4.5%.
The primary trend is up.
The yield on 10-year treasury notes closed higher at 4.37%.
The intermediate trend is uncertain, with price ranging between 4.0 and 4.5%.
The primary trend is up.

The
yield differential (10-year T-notes compared to 13-week
T-bills) is a healthy 3.4%.
Gold
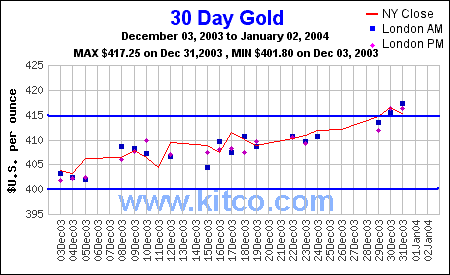
New York (13.30): Spot gold closed at $415.30, testing support after making a 10-year high ( 416.25) on New Year's Eve.
The intermediate trend is up.
The primary trend is up. Expect support at 415 (the previous 10-year high).
New York (13.30): Spot gold closed at $415.30, testing support after making a 10-year high ( 416.25) on New Year's Eve.
The intermediate trend is up.
The primary trend is up. Expect support at 415 (the previous 10-year high).
Subscribe to Incredible Charts Premium
version with:
|
ASX Australia
The All Ordinaries rallied strongly over the last week, closing
at 3309 despite low volumes. If the index is able to penetrate
resistance at 3317, we may see a strong surge in January,
historically a bullish month, as institutional buyers return from
their holidays.
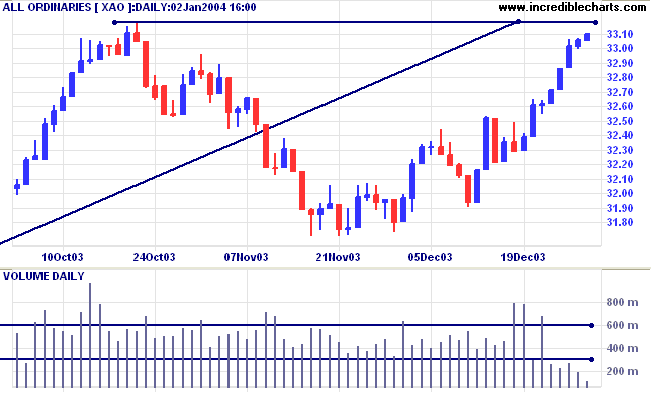
MACD (26,12,9) is above its signal line; Slow Stochastic (20,3,3)
is above.
Short-term: Bullish above 3317.
Short-term: Bullish above 3317.
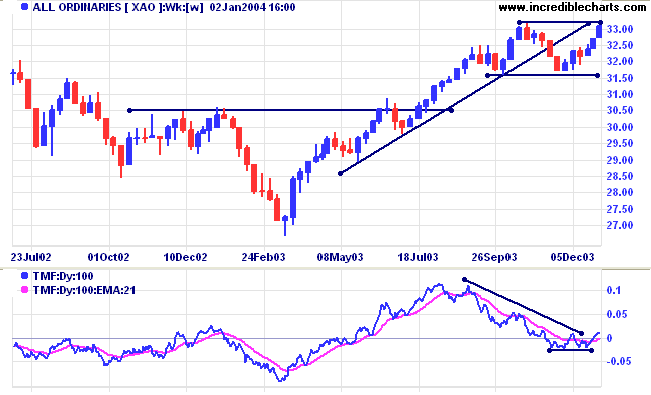
The All Ords is below its long-term trendline, signaling
weakness. The primary trend is up but will reverse if there is a
fall below 3160 (the October 1 low). Twiggs Money Flow (100) has
leveled out but is still bearish after a large divergence.
Intermediate term: Bullish above 3317. Bearish below 3160.
Long-term: Bearish below 3160.
Intermediate term: Bullish above 3317. Bearish below 3160.
Long-term: Bearish below 3160.
Sector Analysis
The 11 sectors (10 + Property) are in various market stages. Relative Strength (xjo) measures the performance of each sector relative to the overall index.
The 11 sectors (10 + Property) are in various market stages. Relative Strength (xjo) measures the performance of each sector relative to the overall index.
- Energy [XEJ] - stage 2 (RS is rising)
- Materials [XMJ] - stage 2 (RS is rising)
- Industrials [XNJ] - stage 2 (RS is rising)
- Consumer Discretionary [XDJ] - stage 2 (RS is falling)
- Consumer Staples [XSJ] - stage 1 (RS is level)
- Health Care [XHJ] - stage 1 (RS is falling)
- Property Trusts [XPJ] - stage 3 (RS is rising).
- Financial excl. Property [XXJ] - stage 4** (RS is level)
- Information Technology [XIJ] - stage 2 (RS is level)
- Telecom Services [XTJ] - stage 2 (RS is falling)
- Utilities [XUJ] - stage 3 (RS is level)
** Financial-x-Property Trusts [XXJ] broke below the 3933
support level but has subsequently retreated back above. This is
a weak signal. Relative Strength (xjo), however, is falling and I
will treat the primary trend as downwards until there is
clear evidence to the contrary. A rise above 4136 will signal
that the primary trend has turned upwards.
Sectors: Relative Strength
A stock screen of the ASX 200 using % Price Move (1 month: +5%) is up at 56 stocks (compared to 131 on April 11, 2003; and 8 on March 14, 2003). Prominent sectors are:
A stock screen of the ASX 200 using % Price Move (1 month: +5%) is up at 56 stocks (compared to 131 on April 11, 2003; and 8 on March 14, 2003). Prominent sectors are:
- Oil & Gas Exploration & Production (6)
- Diversified Metals & Mining (5)
- Broadcasting & Cable TV (3)
- Movies & Entertainment (3)
- Construction Materials (3)
- Banks (3)
- Steel (2)
- Aluminum (2)
Understanding
the Trading Diary has been expanded to offer further
assistance to readers, including directions on how to search the
archives.
Colin Twiggs
The fact is that purification and austerity are even more
necessary
for the appreciation of life and laughter than for anything else.
To let no bird fly past unnoticed, to spell patiently the stones and weeds,
to have the mind a storehouse of sunsets,
requires a discipline in pleasure and an education in gratitude.
~ G.K. Chesterton: Twelve Types
for the appreciation of life and laughter than for anything else.
To let no bird fly past unnoticed, to spell patiently the stones and weeds,
to have the mind a storehouse of sunsets,
requires a discipline in pleasure and an education in gratitude.
~ G.K. Chesterton: Twelve Types

We wish you peace, health and prosperity in the year ahead.
Back Issues
You can now view back issues at the Daily Trading Diary Archives.
You can now view back issues at the Daily Trading Diary Archives.
Back Issues
Access the Trading Diary Archives.

Author: Colin Twiggs is a former investment banker with almost 40 years of experience in financial markets. He co-founded Incredible Charts and writes the popular Trading Diary and Patient Investor newsletters.
Using a top-down approach, Colin identifies key macro trends in the global economy before evaluating selected opportunities using a combination of fundamental and technical analysis.
Focusing on interest rates and financial market liquidity as primary drivers of the economic cycle, he warned of the 2008/2009 and 2020 bear markets well ahead of actual events.
He founded PVT Capital (AFSL No. 546090) in May 2023, which offers investment strategy and advice to wholesale clients.