
We wish our readers peace and goodwill over Christmas
and prosperity in the year ahead.
Trading Diary
December 12, 2003
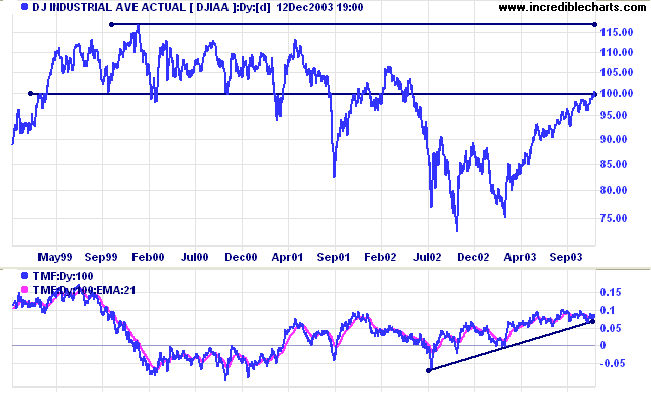
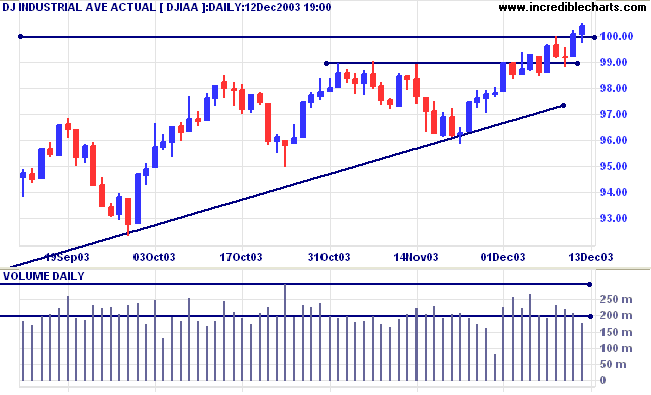
The intermediate trend is up.
The primary trend is up. A fall below support at 9000 will signal reversal.
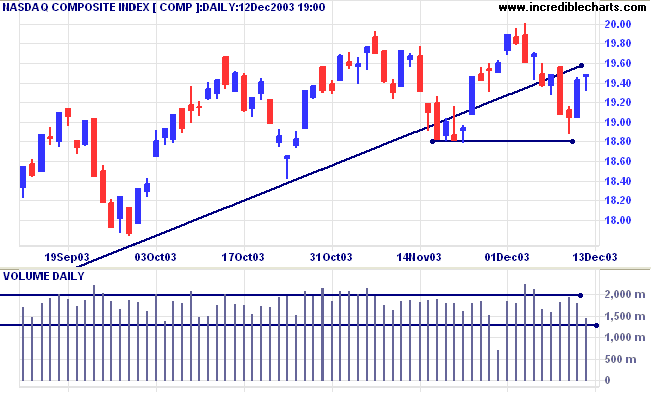
The intermediate trend is uncertain. A fall below 1880 will complete a double top reversal with a target of 1760: 1880-(2000-1880).
The primary trend is up. A fall below support at 1640 will signal reversal.
The intermediate trend is up. The index has broken above the recent consolidation, a bearish sign, but low volume places doubt over the strength of the rally.
Short-term: Bullish if the S&P500 is above resistance at 1070. Bearish below 1053 (Wednesday's low).
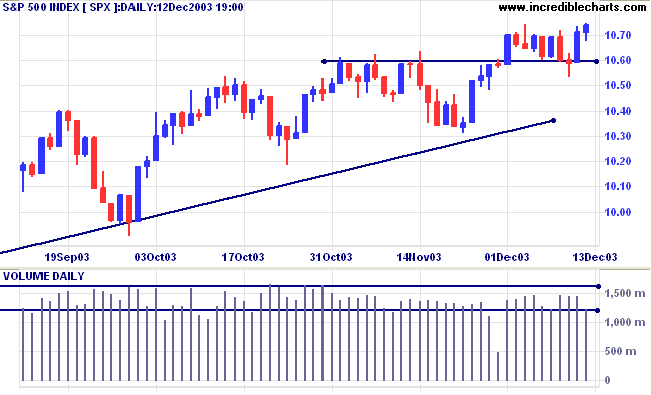
Intermediate: Bullish above 1070.
Long-term: Bullish above 960.
Preliminary December readings of the University of Michigan consumer sentiment index fell to 89.6, from 93.7 in November, while economists were expecting a rise to 96. (more)
NYSE, Nasdaq (including OTC BB) and Amex stocks are now available on Incredible Charts.
Stock screens will be added next week.
Adjusted end-of-day charts are accessible from the Securities menu.
The charts are also accessible from the free version until early 2004.
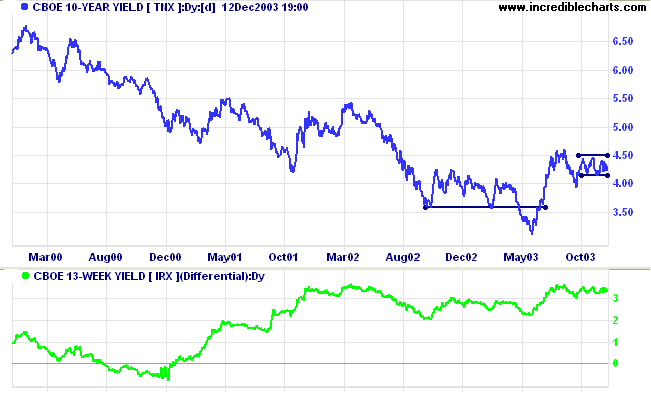
The yield on 10-year treasury notes appears to be consolidating between 4.0% and 4.5%, closing at 4.24% on Friday.
The intermediate down-trend is weak.
The primary trend is up.
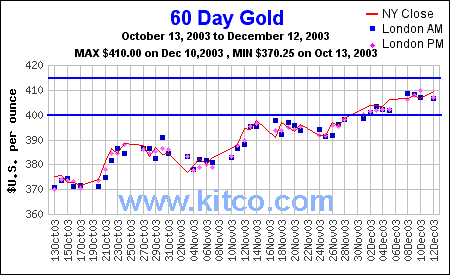
New York (13.30): Spot gold closed the week up at $409.20.
The intermediate trend is up.
The primary trend is up. Expect support at 400, resistance at 415.
Subscribe
to Incredible Charts Premium version with:
|
for only $270 (AUD)
annual subscription
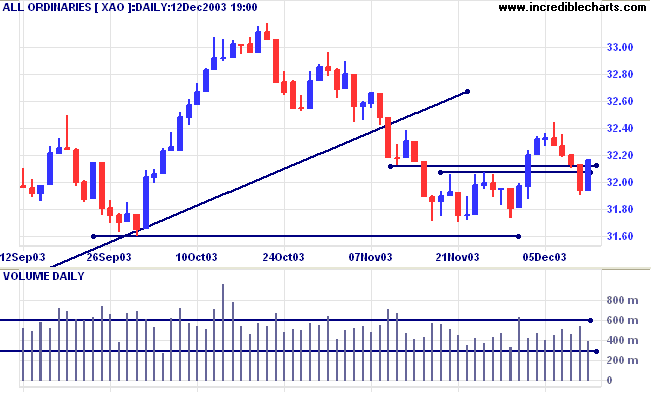
Short-term: Bullish above 3213, Thursday's high. Bearish below 3173 (the December 1 low).
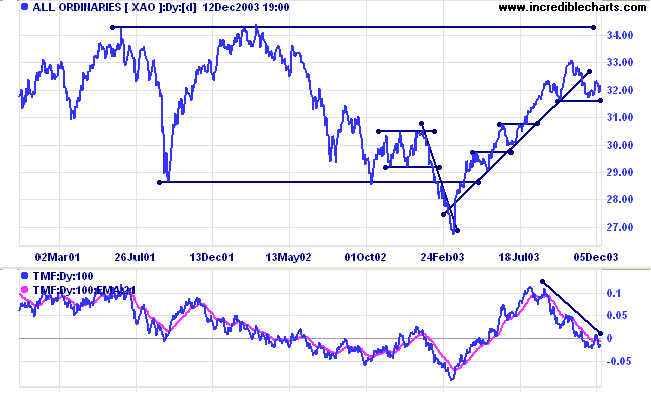
Twiggs Money Flow (100) is below its signal line, indicating distribution, after a bearish triple divergence.
Intermediate term: Bullish above 3213. Bearish below 3160.
Long-term: Bearish below 3160.
The 11 sectors (10 + Property) are in various market stages. Relative Strength (xjo) measures the performance of each sector relative to the overall index.
- Energy [XEJ] - stage 2 (RS is rising)
- Materials [XMJ] - stage 2 (RS is falling)
- Industrials [XNJ] - stage 2 (RS is rising)
- Consumer Discretionary [XDJ] - stage 3 (RS is falling)
- Consumer Staples [XSJ] - stage 1 (RS is rising)
- Health Care [XHJ] - stage 1 (RS is level)
- Property Trusts [XPJ] - stage 3 (RS is rising).
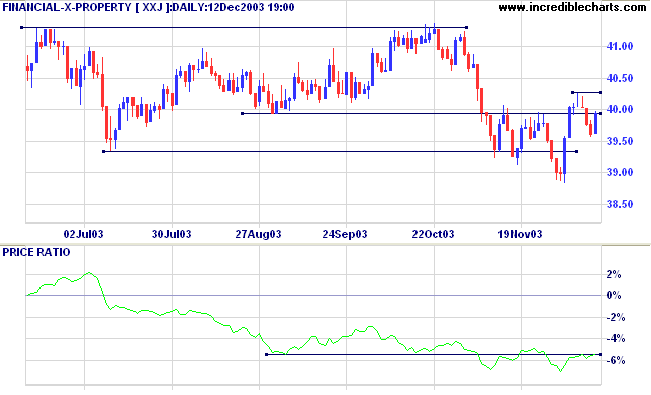
- Financial excl. Property [XXJ] - stage 4** (RS is falling)
- Information Technology [XIJ] - stage 2 (RS is rising)
- Telecom Services [XTJ] - stage 2 (RS is falling)
- Utilities [XUJ] - stage 3 (RS is level)
The intermediate trend will reverse up if the index rises above the recent high of 4026.
A rise above 4136 will signal that the primary trend has turned upwards.
A stock screen of the ASX 200 using % Price Move (1 month: +5%) is at a low 19 stocks (compared to 131 on April 11, 2003; and 8 on March 14, 2003). Prominent sectors are:
- Real Estate Investment Trusts (6)
-
Biotechnology
Peptech [PTD] and Novogen [NRT] head the overall list with gains of 24% and 21% over the last month.
Stocks analyzed during the week were:
- Alinta - ALN
- CSL Limited - CSL
- Lion Nathan - LNN
- Caltex - CTX
- Novogen - NRT
- Wattyl - WYL
- Cochlear - COH
......whether or not it is clear to
you,
no doubt the universe is unfolding as it
should.
Therefore be at peace with God,
whatever you conceive Him to be,
and whatever your labors and aspirations,
in the noisy confusion of life keep peace with your
soul.
~ Max Ehrmann: Desiderata
(1927)
What are dilution adjustments?
Why does Incredible Charts adjust price history for dilutions?
How are the adjustments calculated?
Details are at the above link.
You can now view back issues at the Daily Trading Diary Archives.
Back Issues

Author: Colin Twiggs is a former investment banker with almost 40 years of experience in financial markets. He co-founded Incredible Charts and writes the popular Trading Diary and Patient Investor newsletters.
Using a top-down approach, Colin identifies key macro trends in the global economy before evaluating selected opportunities using a combination of fundamental and technical analysis.
Focusing on interest rates and financial market liquidity as primary drivers of the economic cycle, he warned of the 2008/2009 and 2020 bear markets well ahead of actual events.
He founded PVT Capital (AFSL No. 546090) in May 2023, which offers investment strategy and advice to wholesale clients.
