Incredible
Posts: Best of the Forum
A collection of the most highly-rated posts since the start of the Forum.
Thanks to Mosaic for coming up with the idea and providing the initial list
and to all the contributors.
A collection of the most highly-rated posts since the start of the Forum.
Thanks to Mosaic for coming up with the idea and providing the initial list
and to all the contributors.
Trading Diary
December 4, 2003
These extracts from my daily trading diary
are for educational purposes
and should not be interpreted as investment
advice. Full terms and conditions can be found at Terms
of Use .
USA
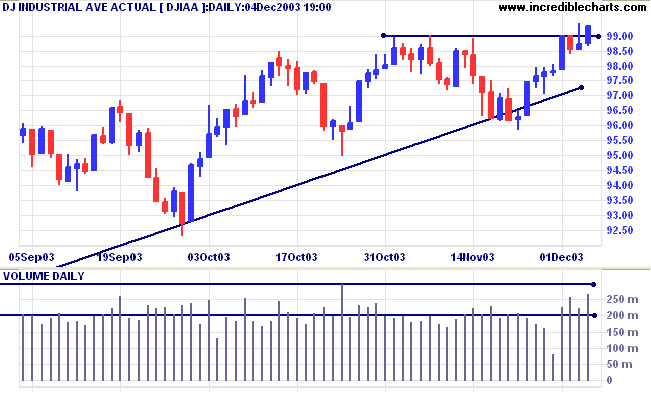
The Dow Industrial Average broke through
resistance to close at 9930 on higher volume.
The intermediate trend is uncertain.
The primary trend is up. A fall below support at 9000 will signal reversal.
The intermediate trend is uncertain.
The primary trend is up. A fall below support at 9000 will signal reversal.
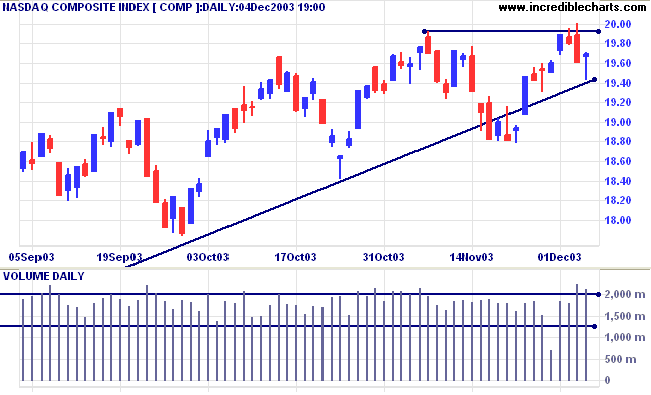
The Nasdaq Composite tested the primary
supporting trendline before recovering to close at 1968 on strong
volume.
The intermediate trend is uncertain.
The primary trend is up. A fall below support at 1640 will signal reversal.
The intermediate trend is uncertain.
The primary trend is up. A fall below support at 1640 will signal reversal.
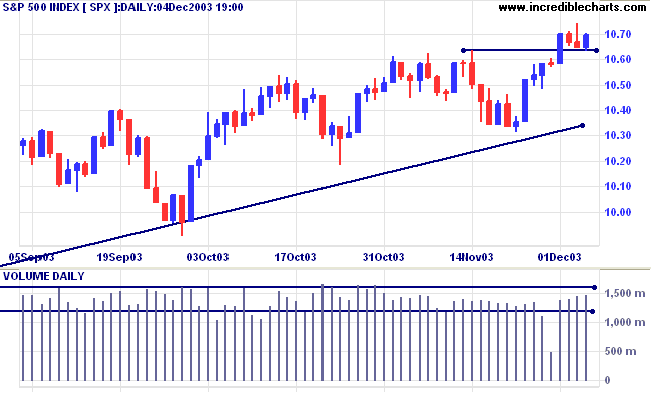
The S&P 500 tested support before rallying
to close at 1069 on higher volume.
The intermediate trend is uncertain. The 3-day consolidation often occurs at the mid-point in a rally. If there is a breakout, the likely target is 1100: (1070 + (1070 - 1037) = 1103.
Short-term: Bullish if the S&P500 is above the high of 1070. Bearish below 1063 (Today's low).
The intermediate trend is uncertain. The 3-day consolidation often occurs at the mid-point in a rally. If there is a breakout, the likely target is 1100: (1070 + (1070 - 1037) = 1103.
Short-term: Bullish if the S&P500 is above the high of 1070. Bearish below 1063 (Today's low).
The primary trend is up. A fall below 960 will
signal reversal.
Intermediate: Bullish above 1063.
Long-term: Bullish above 960.
Intermediate: Bullish above 1063.
Long-term: Bullish above 960.
The Chartcraft NYSE Bullish % Indicator slipped
to 81.78% (December 4).
Scrap steel signals inflation
The price of scrap steel is a useful advance indicator of the economy, but the 40% price rise in the last year warns of inflation. (more)
Bush axes steel tariffs
The president ends steel import tariffs to avert a trade war with the EU. (more)
Treasury yields
The yield on 10-year treasury notes is consolidating in a narrow range, closing at 4.36%.
The intermediate trend is down.
The primary trend is up.
The yield on 10-year treasury notes is consolidating in a narrow range, closing at 4.36%.
The intermediate trend is down.
The primary trend is up.
Gold
New York (20.13): Spot gold is at $401.70 after testing support at 400.
The intermediate trend is up.
The primary trend is up. Expect support at 400, resistance at 415.
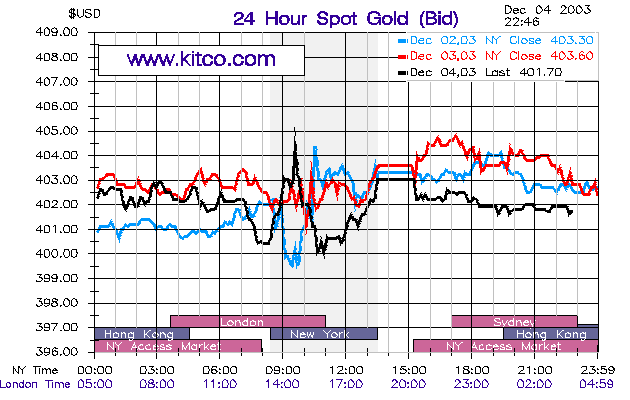
New York (20.13): Spot gold is at $401.70 after testing support at 400.
The intermediate trend is up.
The primary trend is up. Expect support at 400, resistance at 415.
ASX Australia
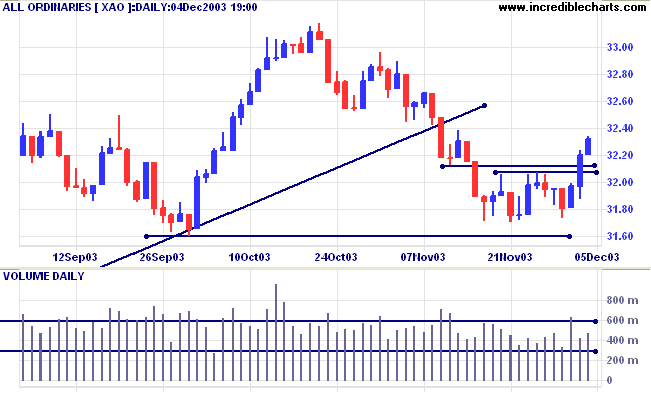
The All Ordinaries rally continues, with the index closing up 11
points at 3231 on higher volume.
The intermediate trend has reversed up.
MACD (26,12,9) has crossed above its signal line; Slow Stochastic (20,3,3) is above.
Short-term: Bullish if the All Ords is above 3212, the November 12 low. Bearish below 3173 (Monday's low).
XAO is below its long-term trendline, signaling weakness. The primary trend is up but will reverse if there is a fall below 3160 (the October 1 low). Declining weekly volume increases the likelihood that support at 3160 will hold. Twiggs Money Flow (100) is still in a down-trend but has crossed above its signal line.
Intermediate term: Bullish above 3212. Bearish below 3160.
Long-term: Bearish below 3160.
Brambles [BIL]
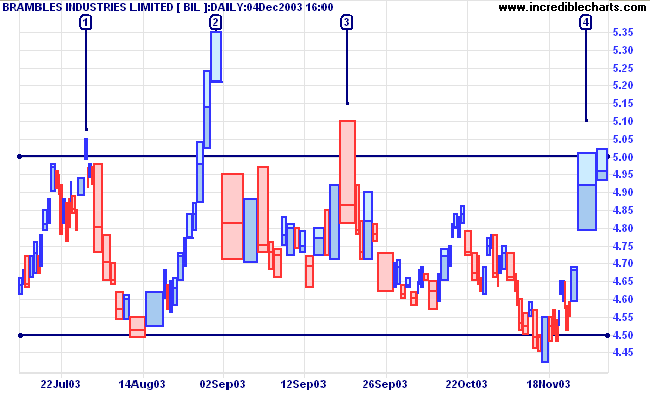
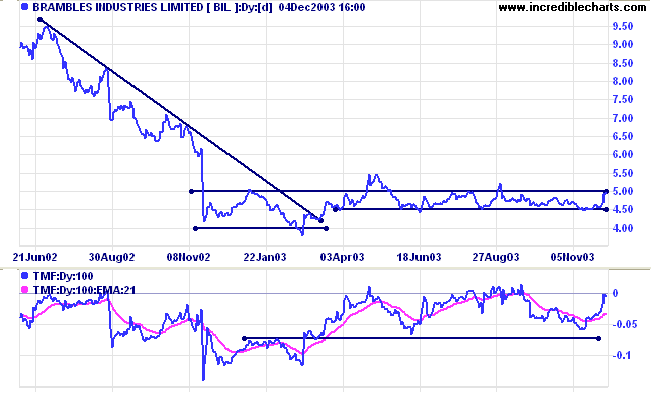
BIL has formed a broad base over the last 12 months, covered in my Diary on August 26, 2003. Price is once again testing resistance at 5.00, while Twiggs Money Flow (100) is rising.
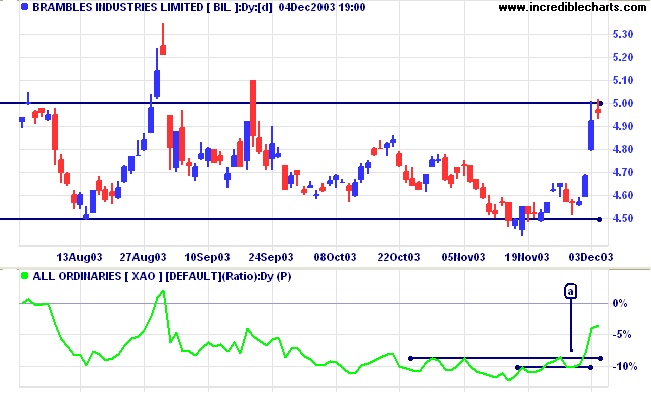
Relative Strength (xao) is rising. A short-term signal was given
at [a]. A stronger signal will be given if the next pull-back
respects the longer RS support line.
The Equivolume chart has more false breaks than an Indian spin
bowler. A breakout-traders nightmare. Resistance is particularly
strong, with weak closes and strong volume at [2], [3] and [4]
signaling selling pressure.
It is rather late in the market rally to be looking for long
entries, but I will keep watching BIL for further developments.
An upward breakout, followed by a pull-back that respects the new
5.00 support level, would be hard to resist. Especially if
accompanied by a similar pattern on the Relative Strength chart.
Understanding
the Trading Diary has been expanded to offer further
assistance to readers, including
directions on how to search the archives.
Colin Twiggs
Even with a high positive expectancy system you
can still lose money.
If you risk too much on a trade and you lose,
you can (and probably will) have trouble recovering.
~ Van K Tharp: Trade your way to Financial Freedom.
If you risk too much on a trade and you lose,
you can (and probably will) have trouble recovering.
~ Van K Tharp: Trade your way to Financial Freedom.
US stocks
The complete NYSE, Nasdaq and Amex exchanges are on the new server.
We are adding some finishing touches before releasing the new version in the next day or two.
Back Issues
You can now view back issues at the Daily Trading Diary Archives.
Back Issues
Access the Trading Diary Archives.