
Trading Diary
November 21, 2003
These extracts from my daily trading diary are
for educational purposes and should not be interpreted as
investment advice. Full terms and conditions can be found at
Terms
of Use .
| The service may be interrupted on Sunday between 2:00 a.m. and 4:00 a.m. (Sydney time) to replace a faulty network card on the new server. |
USA
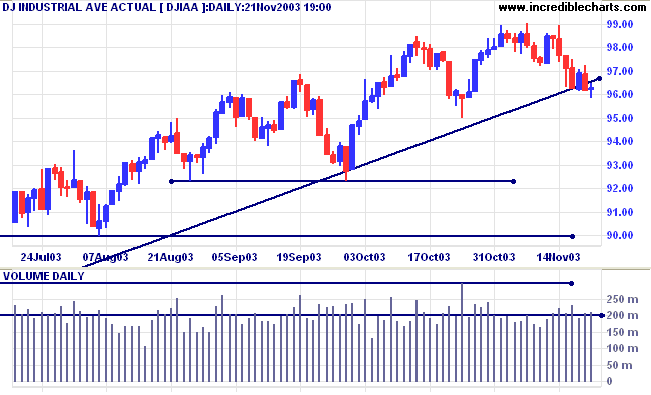
The Dow Industrial Average closed almost unchanged at 9629 on low
volume, having broken below the primary trendline.
The intermediate trend is down. Expect support at 9500 and 9230.
The primary trend is up. A fall below support at 9000 will signal reversal.
The intermediate trend is down. Expect support at 9500 and 9230.
The primary trend is up. A fall below support at 9000 will signal reversal.
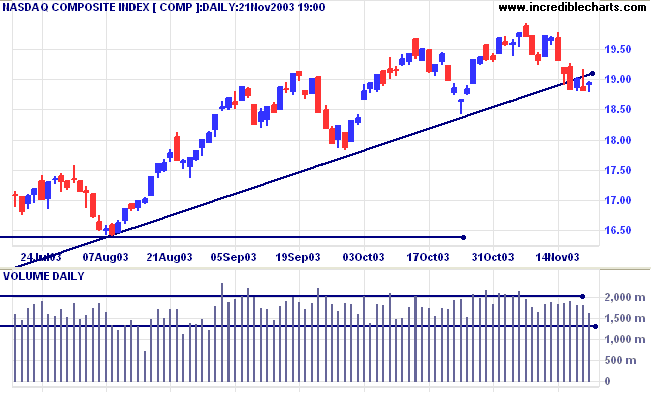
The Nasdaq Composite is consolidating after having broken the
primary trendline, closing up 12 points at 1894 on lower
volume.
The intermediate trend is down. Expect support at 1840 and 1780.
The primary trend is up. A fall below support at 1640 will signal reversal.
The intermediate trend is down. Expect support at 1840 and 1780.
The primary trend is up. A fall below support at 1640 will signal reversal.
The S&P 500 consolidated, closing 1 point up at 1035 on lower
volume.
The intermediate trend is down. Expect a test of the primary trendline, with further support at 990.
Short-term: Bullish if the S&P500 is above the high of 1062. Bearish below 1034 (Tuesday's low).
The intermediate trend is down. Expect a test of the primary trendline, with further support at 990.
Short-term: Bullish if the S&P500 is above the high of 1062. Bearish below 1034 (Tuesday's low).
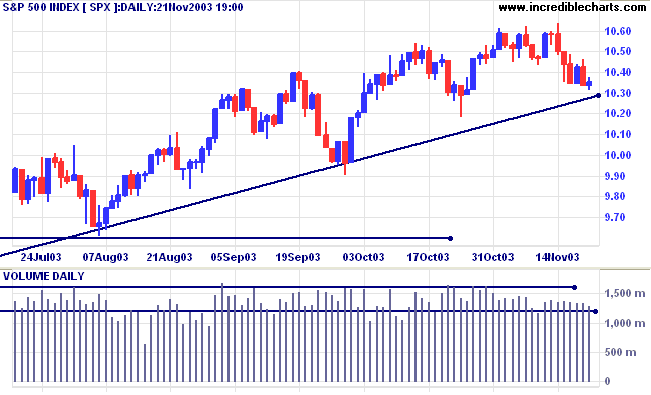
The primary trend is up. A fall below 960 will signal
reversal.
Intermediate: Bullish above 1062.
Long-term: Bullish above 960.
Intermediate: Bullish above 1062.
Long-term: Bullish above 960.
The Chartcraft NYSE Bullish % Indicator fell to
79.71% (November 21).
Dorsey maintains that a fall below 70 ( and not a 3-box reversal) signals a bear alert.
Dorsey maintains that a fall below 70 ( and not a 3-box reversal) signals a bear alert.
Catch 22
A weak dollar will make US exports more competitive in overseas markets. But a fall in the dollar will hurt US bond and stock markets, placing upward pressure on interest rates, with a negative impact on the economy. (more)
A weak dollar will make US exports more competitive in overseas markets. But a fall in the dollar will hurt US bond and stock markets, placing upward pressure on interest rates, with a negative impact on the economy. (more)
Treasury yields
The yield on 10-year treasury notes closed down at 4.15%.
The intermediate trend has turned down after bearish equal highs at [2] and [3] below a higher peak at [1].
The primary trend is up.
The yield on 10-year treasury notes closed down at 4.15%.
The intermediate trend has turned down after bearish equal highs at [2] and [3] below a higher peak at [1].
The primary trend is up.
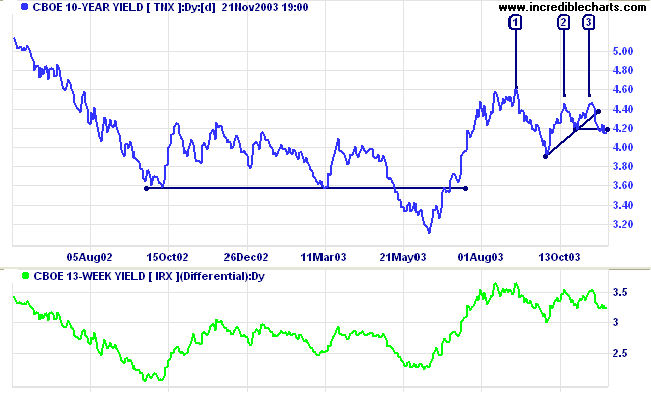
The
yield differential is healthy at 3.2% (10-year T-notes
compared to 13-week T-bills).
Gold
New York (13.30): Spot gold consolidated just below resistance at 400, a bullish sign, closing the week at $395.80.
The intermediate trend is up.
The primary trend is up. Expect resistance at 400 to 415.
New York (13.30): Spot gold consolidated just below resistance at 400, a bullish sign, closing the week at $395.80.
The intermediate trend is up.
The primary trend is up. Expect resistance at 400 to 415.
ASX Australia
The All Ordinaries fell 18 points to close at 3175 on lower
volume.
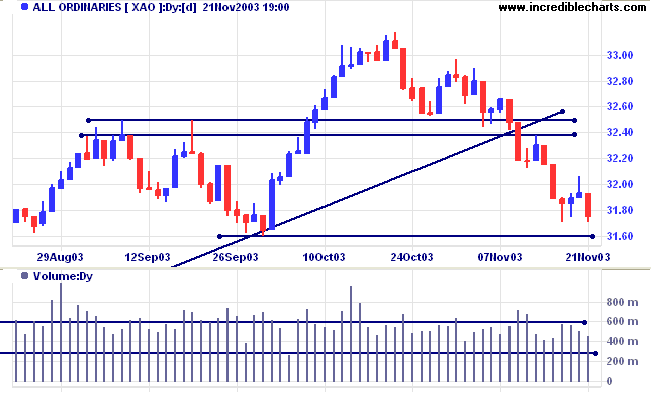
The intermediate trend is down and the index appears headed for a
test of support at 3160.
MACD (26,12,9) is below its signal line; Slow Stochastic (20,3,3) has whipsawed above.
Short-term: Bullish if the All Ords crosses back above resistance at 3250. Bearish below 3189 (Thursday's low).
MACD (26,12,9) is below its signal line; Slow Stochastic (20,3,3) has whipsawed above.
Short-term: Bullish if the All Ords crosses back above resistance at 3250. Bearish below 3189 (Thursday's low).
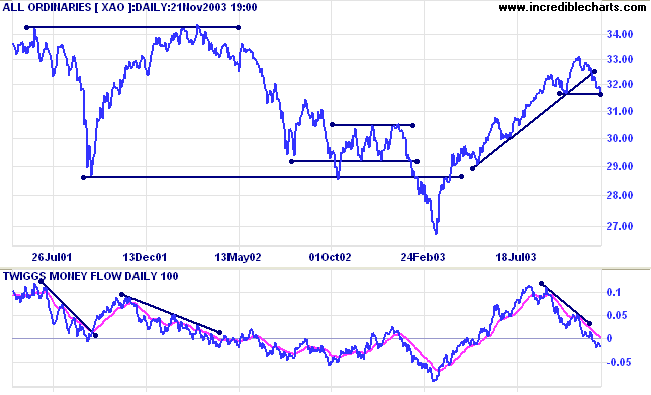
XAO has now broken below the long-term trendline, signaling
weakness. The primary trend is up but will reverse if there is a
fall below 3160 (October 1 low).
Twiggs Money Flow (100) signals distribution after a bearish triple divergence.
Intermediate term: Bullish above 3250. Bearish below 3160.
Long-term: Bearish below 3160.
Twiggs Money Flow (100) signals distribution after a bearish triple divergence.
Intermediate term: Bullish above 3250. Bearish below 3160.
Long-term: Bearish below 3160.
Sector Analysis
The 11 sectors (10 + Property) are in various market stages. Relative Strength (xjo) measures the performance of each sector relative to the overall index.
The 11 sectors (10 + Property) are in various market stages. Relative Strength (xjo) measures the performance of each sector relative to the overall index.
- Energy [XEJ] - stage 2 (RS is rising)
- Materials [XMJ] - stage 2 (RS is falling)
- Industrials [XNJ] - stage 2 (RS is rising)
- Consumer Discretionary [XDJ] - stage 2 (RS is level)
- Consumer Staples [XSJ] - stage 1 (RS is falling)
- Health Care [XHJ] - stage 2 (RS is level)
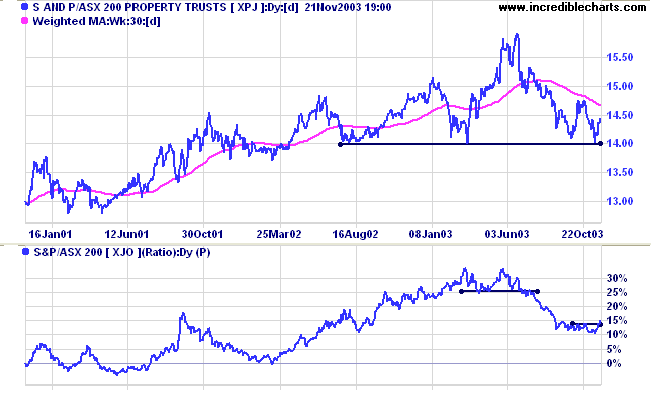
- Property Trusts [XPJ] - stage 3 (RS is level).
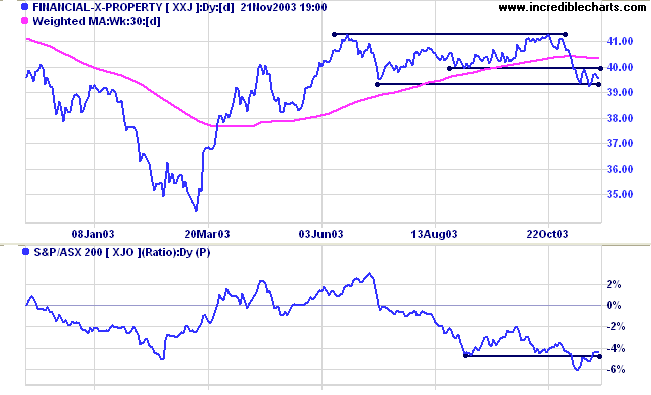
- Financial excl. Property [XXJ] - stage 3 (RS is falling)
- Information Technology [XIJ] - stage 2 (RS is rising)
- Telecom Services [XTJ] - stage 2 (RS is falling)
- Utilities [XUJ] - stage 3 (RS is falling)
Property [XXJ] has rallied off support at 1400. A fall below this
level will signal the start of stage 4. Relative Strength (xjo)
leveled out after a steep fall.
Financial-x-Property [XXJ] is consolidating between 3995 and
3934; a bearish sign, especially if accompanied by declining
Relative Strength (xjo).
Sectors: Relative Strength
A stock screen of the ASX 200 using % Price Move (1 month: +5%) continues to fall, reaching 15 stocks (compared to 131 on April 11, 2003; and 8 on March 14, 2003). There are no prominent sectors.
A stock screen of the ASX 200 using % Price Move (1 month: +5%) continues to fall, reaching 15 stocks (compared to 131 on April 11, 2003; and 8 on March 14, 2003). There are no prominent sectors.
Daily Trading Diary
Stocks analyzed during the week were:
Stocks analyzed during the week were:
- Ventracor - VCR
- Ansell - ANN
- Billabong - BBG
- Peptech - PTD
- Hardman Resources - HDR
Understanding
the Trading Diary has been expanded to offer further
assistance to readers, including directions on how to search the
archives.
Colin Twiggs
It is always wise to look ahead,
but difficult to look further than you can see.
~ Winston Churchill.
but difficult to look further than you can see.
~ Winston Churchill.
Incredible Charts Premium version with adjusted data and hourly updates
and the Daily Trading Diary.
Back Issues
You can now view back issues at the Daily Trading Diary Archives.
You can now view back issues at the Daily Trading Diary Archives.
Back Issues
Access the Trading Diary Archives.

Author: Colin Twiggs is a former investment banker with almost 40 years of experience in financial markets. He co-founded Incredible Charts and writes the popular Trading Diary and Patient Investor newsletters.
Using a top-down approach, Colin identifies key macro trends in the global economy before evaluating selected opportunities using a combination of fundamental and technical analysis.
Focusing on interest rates and financial market liquidity as primary drivers of the economic cycle, he warned of the 2008/2009 and 2020 bear markets well ahead of actual events.
He founded PVT Capital (AFSL No. 546090) in May 2023, which offers investment strategy and advice to wholesale clients.