|
US stocks ETOs and warrants are now available. Our target now is to have NYSE, Nasdaq and Amex charts available by next Friday. |
Trading Diary
October 31, 2003
The intermediate trend is down.
The primary trend is up. A fall below 9000 will signal reversal.
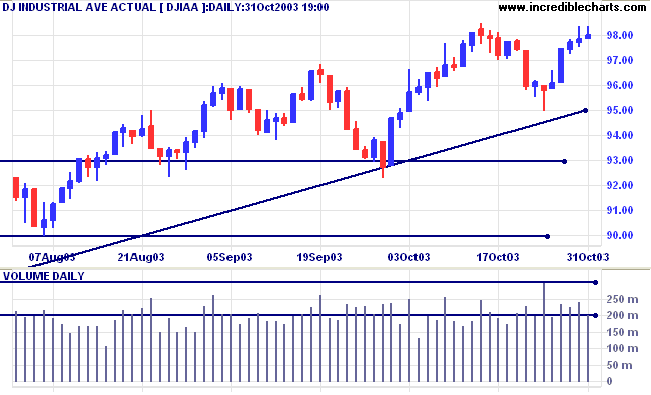
The intermediate down- trend is weak.
The primary trend is up. A fall below 1640 will signal reversal.
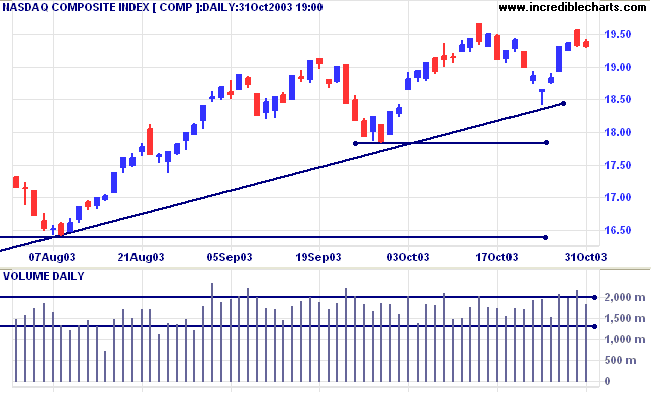
The intermediate down- trend is weak.
The primary trend is up. A fall below 960 will signal reversal.
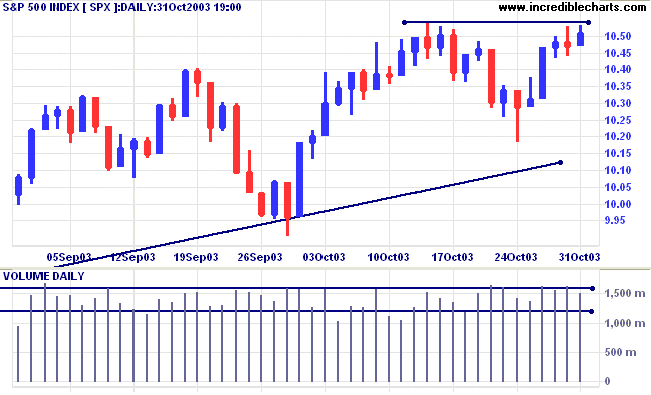
Short-term: Bullish if the S&P500 is above 1054. Bearish below 1026.
Intermediate: Bullish above 1054.
Long-term: Bullish above 960.
Consumer spending fell 0.3% in September after rising 1.1% in August. (more)
Like GDP growth, this is a lagging rather than a leading indicator and is most likely already discounted in current market prices.
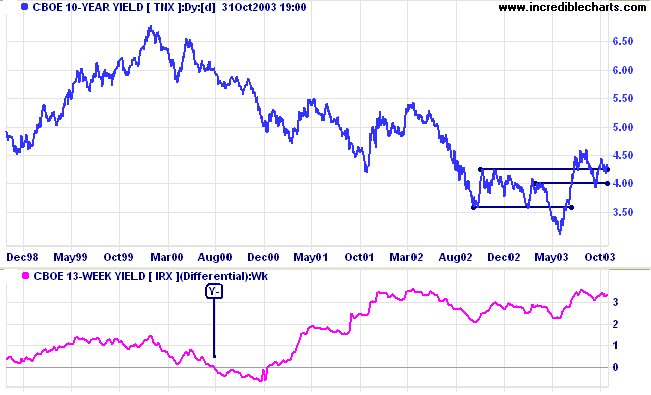
The yield on 10-year treasury notes increased to 4.30%.
The intermediate down-trend is weak.
The primary trend is up.
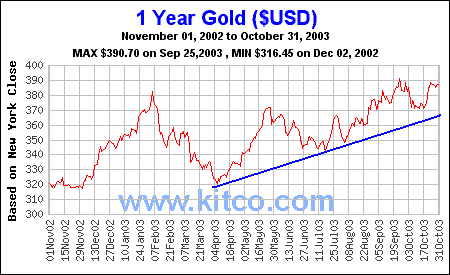
New York (13.30): Spot gold is up at $384.10.
The intermediate trend is up.
The primary trend is up. Expect resistance at 400 to 415.
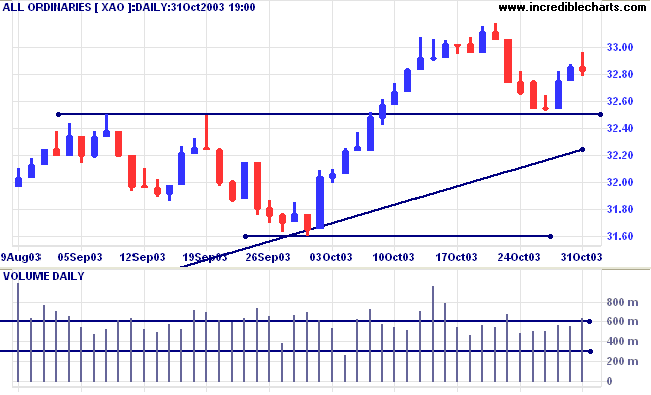
The primary trend is up. The rally is extended and probability of a reversal increases with each successive primary trend movement.
A fall below 3160 will signal reversal.
MACD (26,12,9) is below its signal line; Slow Stochastic (20,3,3) is above; Twiggs Money Flow (100) is below its signal line and displays a bearish "triple" divergence.
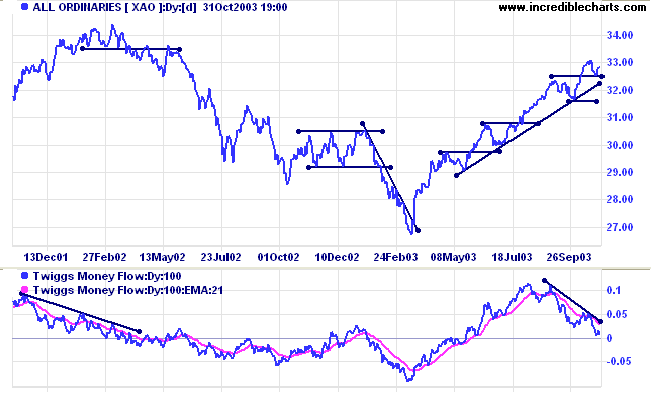
Short-term: Bullish if the All Ords is above 3317. Bearish below 3250.
Intermediate: Bullish above 3317.
Long-term: Bullish above 3160.
Materials, Consumer Discretionary and Information Technology are the most promising, with rising Relative Strength (xjo).
- Energy [XEJ] - stage 2 (RS is level).
- Materials [XMJ] - stage 2 (RS is rising)
- Industrials [XNJ] - stage 2 (RS is level).
- Consumer Discretionary [XDJ] - stage 2 (RS is rising)
- Consumer Staples [XSJ] - stage 1 (RS is falling)
- Health Care [XHJ] - stage 2 (RS is level)
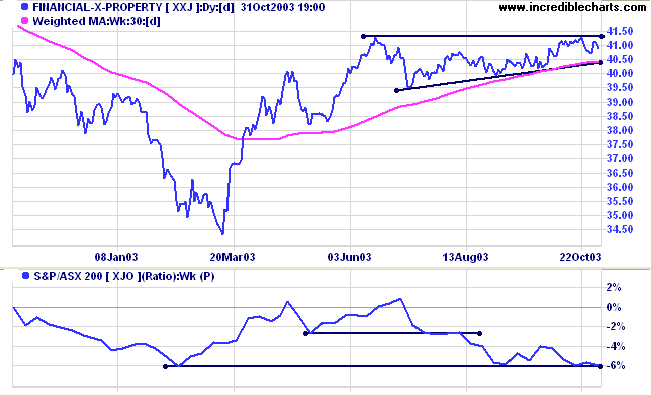
- Property Trusts [XPJ] - stage 3 (RS is falling)
- Financial excl. Property [XXJ] - stage 2 (RS is falling)
- Information Technology [XIJ] - stage 2 (RS is rising)
- Telecom Services [XTJ] - stage 2 (RS is level).
- Utilities [XUJ] - stage 3 (RS is falling)
A stock screen of the ASX 200 using % Price Move (1 month: +5%) rose to 73 stocks (compared to 131 on April 11, 2003; and 8 on March 14, 2003).
- Diversified Metals & Mining (6)
- Broadcasting & Cable TV (5)
- Publishing (4)
- Gold (4)
Diversified Financial (4) - Construction & Engineering (3)
- Movies & Entertainment (3)
- Casinos & Gaming (3)
- Diversified Commercial (3)
Stocks analyzed during the week were:
- St George Bank - SGB
- Westpac - WBC
- Resmed - RMD
- ERG Limited - ERG
- Smorgon Steel - SSX
- Onesteel - OST
- BHP Steel - BSL
- Ventacor - VCR
This is a common principle with them and shows fallacious reasoning.
In stock fluctuations, prices advance and decline, or vice versa, as it is a bull or a bear market.
Therefore when a stock is 'strongest', to the superficial eye, it is really 'weakest',
for then it can be sold for a reaction, just as it is sold by the so-called insiders.
~ SA Nelson: The ABC of Stock Speculation (1903).
but the data feed is still beta at this stage.
You can now view back issues at the Daily Trading Diary Archives.
Back Issues

Author: Colin Twiggs is a former investment banker with almost 40 years of experience in financial markets. He co-founded Incredible Charts and writes the popular Trading Diary and Patient Investor newsletters.
Using a top-down approach, Colin identifies key macro trends in the global economy before evaluating selected opportunities using a combination of fundamental and technical analysis.
Focusing on interest rates and financial market liquidity as primary drivers of the economic cycle, he warned of the 2008/2009 and 2020 bear markets well ahead of actual events.
He founded PVT Capital (AFSL No. 546090) in May 2023, which offers investment strategy and advice to wholesale clients.
