|
US Charts With ETOs and warrants available, we can now focus on the US market: NYSE, Nasdaq and Amex stocks. Our target is next Friday. |
Trading Diary
October 30, 2003
These extracts from my daily trading diary
are for educational purposes
and should not be interpreted as investment
advice. Full terms and conditions can be found at Terms
of Use .
USA
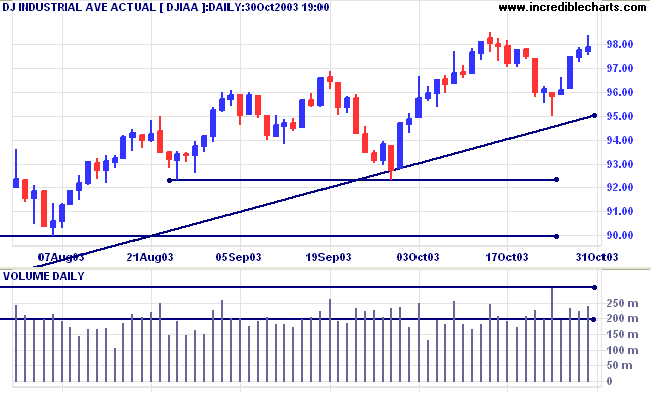
The Dow Industrial Average encountered increased selling
pressure, rising slightly to 9787 on increased
volume.
The intermediate trend is down.
The primary trend is up. A fall below 9000 will signal reversal.
The intermediate trend is down.
The primary trend is up. A fall below 9000 will signal reversal.
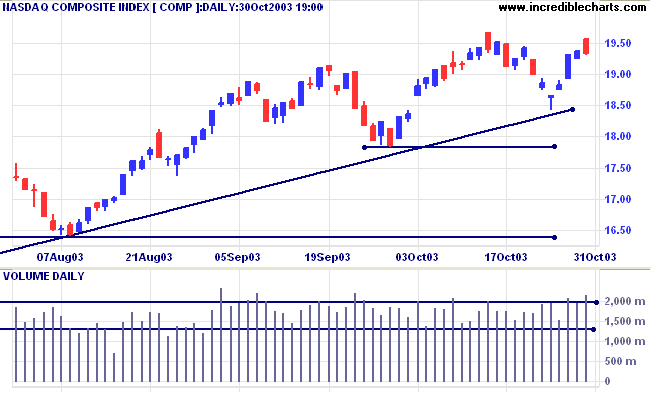
The Nasdaq Composite formed a
closing price reversal: closing 4 points lower at 1933 on
strong volume.
The intermediate trend is down.
The primary trend is up. A fall below 1640 will signal reversal.
The intermediate trend is down.
The primary trend is up. A fall below 1640 will signal reversal.
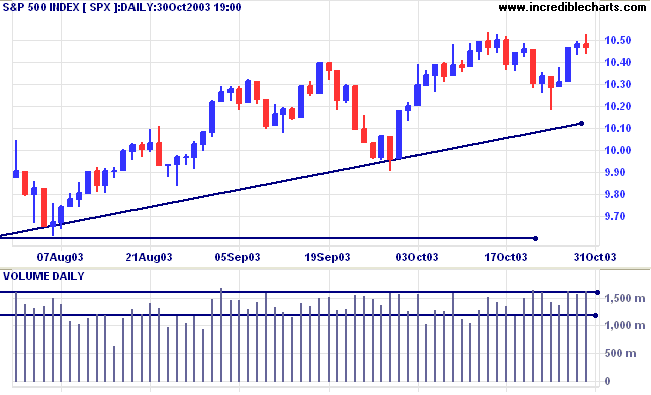
The S&P 500 reflects continued selling pressure, closing 1
point lower at 1047 on strong volume.
The intermediate trend is down.
The primary trend is up. A fall below 960 will signal reversal.
The intermediate trend is down.
The primary trend is up. A fall below 960 will signal reversal.
The Chartcraft NYSE Bullish % Indicator eased
slightly to 80.74% (October 30).
Market Strategy
Short-term: Bullish if the S&P500 is above 1054. Bearish below 1026.
Intermediate: Bullish above 1054.
Long-term: Bullish above 960.
Short-term: Bullish if the S&P500 is above 1054. Bearish below 1026.
Intermediate: Bullish above 1054.
Long-term: Bullish above 960.
GDP growth
GDP growth jumped to a record annual rate of 7.2% in the third quarter, compared to 3.3% last quarter. (more)
GDP growth jumped to a record annual rate of 7.2% in the third quarter, compared to 3.3% last quarter. (more)
Jobless claims lower
New unemployment claims are down at 386,000 compared to 391,000 last week. (more)
New unemployment claims are down at 386,000 compared to 391,000 last week. (more)
Treasury yields
The yield on 10-year treasury notes rallied to 4.34%.
The intermediate trend is down.
The primary trend is up.
The yield on 10-year treasury notes rallied to 4.34%.
The intermediate trend is down.
The primary trend is up.
Gold
New York (17:32): After reaching 391.00 spot gold retreated to $382.80.
The intermediate trend is up.
The primary trend is up. Expect resistance at 400 to 415.
New York (17:32): After reaching 391.00 spot gold retreated to $382.80.
The intermediate trend is up.
The primary trend is up. Expect resistance at 400 to 415.
ASX Australia
The All Ordinaries gained 10 points to close at 3285 on average
volume.
Initial support is at 3238 to 3250; resistance at 3317.
Initial support is at 3238 to 3250; resistance at 3317.
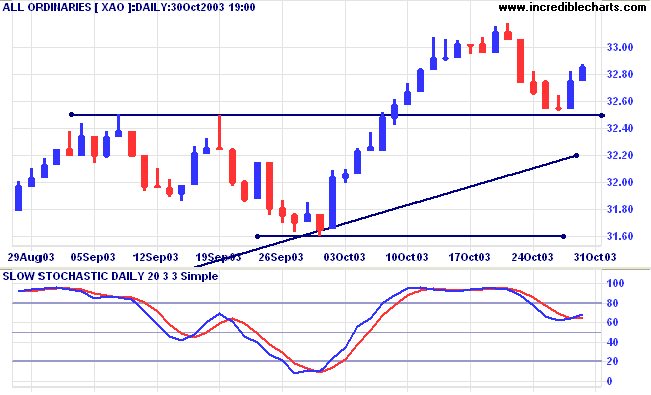
The intermediate up-trend is weak.
The primary trend is up. The rally is extended and the probability of a reversal increases with each successive primary trend movement.
A fall below 3160 will signal reversal.
MACD (26,12,9) is below its signal line; Slow Stochastic (20,3,3) has crossed to above; Twiggs Money Flow (100) is below its signal line and displays a bearish "triple" divergence.
Market Strategy
Short-term: Bullish if the All Ords is above 3317. Bearish below 3238.
Intermediate: Bullish above 3317.
Long-term: Bullish above 3160.
Short-term: Bullish if the All Ords is above 3317. Bearish below 3238.
Intermediate: Bullish above 3317.
Long-term: Bullish above 3160.
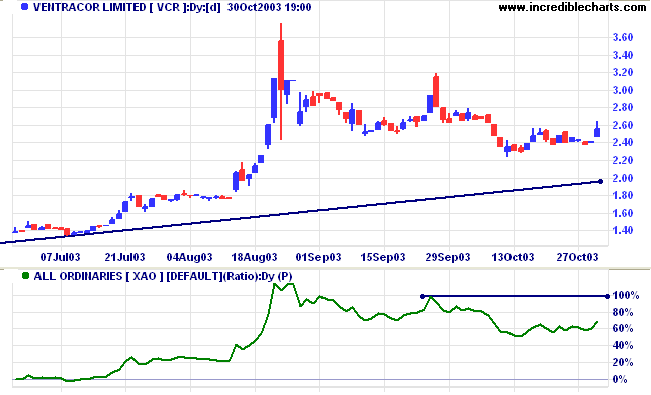
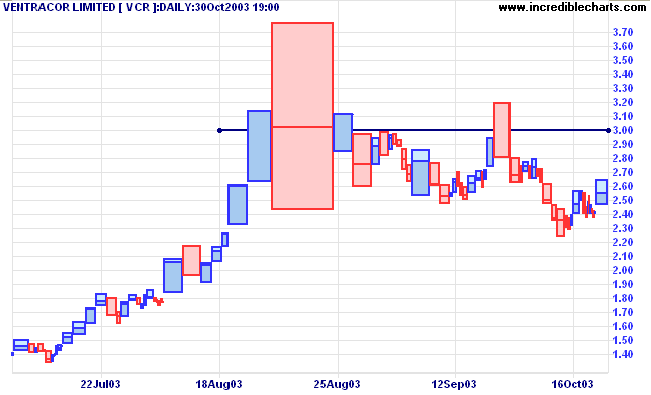
Ventracor [VCR]
VCR experienced a sharp price spike at [a]. Also known as a "blow-off" or a "parabolic curve", the rapidly accelerating trend is unsustainable and inevitably ends with a retreat back to the long-term trendline, normally a lot sharper than below. Twiggs Money Flow (100) shows a similar pattern but, so far, has held above zero.
VCR experienced a sharp price spike at [a]. Also known as a "blow-off" or a "parabolic curve", the rapidly accelerating trend is unsustainable and inevitably ends with a retreat back to the long-term trendline, normally a lot sharper than below. Twiggs Money Flow (100) shows a similar pattern but, so far, has held above zero.
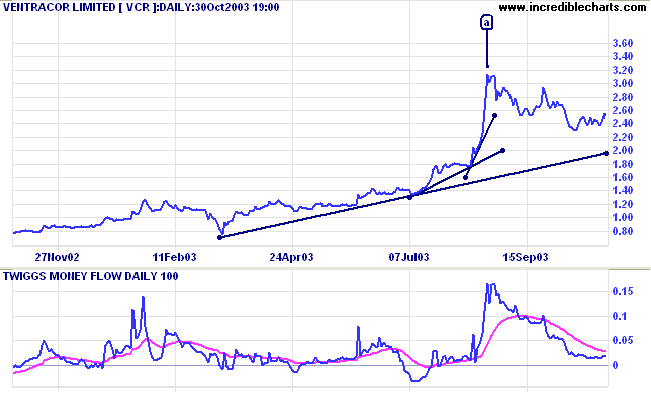
The intermediate trend has turned up and Relative Strength (xao)
is rising. A rise above the September high on RS will signal
return of a strong primary up-trend.
The massive reversal volume shows best on the equivolume chart.
This is likely to reinforce resistance at 3.00.
Understanding
the Trading Diary has been expanded to offer further
assistance to readers, including
directions on how to search the archives.
Colin Twiggs
Approach trading in the same way as you would
approach
three minutes in the ring with a professional boxer.
Your primary objective is to survive:
prepare thoroughly; develop a game plan;
know exactly what you are going to do in every situation;
never let your guard down;
and don't get cocky - overestimating your ability will get you hurt.
three minutes in the ring with a professional boxer.
Your primary objective is to survive:
prepare thoroughly; develop a game plan;
know exactly what you are going to do in every situation;
never let your guard down;
and don't get cocky - overestimating your ability will get you hurt.
Edit Indicator Settings
|
To edit an indicator: (1) open the indicator panel (main Menu: Indicators); (2) select an indicator in the the right column (eg. MACD, Daily,26,12,9,HideHistogram;;;); (3) amend the settings in the center column (eg. select ShowHistogram); (4) save (>) and exit (x). |
Back Issues
You can now view back issues at the Daily Trading Diary Archives.
You can now view back issues at the Daily Trading Diary Archives.
Back Issues
Access the Trading Diary Archives.

Author: Colin Twiggs is a former investment banker with almost 40 years of experience in financial markets. He co-founded Incredible Charts and writes the popular Trading Diary and Patient Investor newsletters.
Using a top-down approach, Colin identifies key macro trends in the global economy before evaluating selected opportunities using a combination of fundamental and technical analysis.
Focusing on interest rates and financial market liquidity as primary drivers of the economic cycle, he warned of the 2008/2009 and 2020 bear markets well ahead of actual events.
He founded PVT Capital (AFSL No. 546090) in May 2023, which offers investment strategy and advice to wholesale clients.