|
US Charts With ETOs and warrants available, we can now focus on the US market: NYSE, Nasdaq and Amex exchanges. Our target is next Friday. |
Trading Diary
October 29, 2003
These extracts from my daily trading diary
are for educational purposes
and should not be interpreted as investment
advice. Full terms and conditions can be found at Terms
of Use .
USA
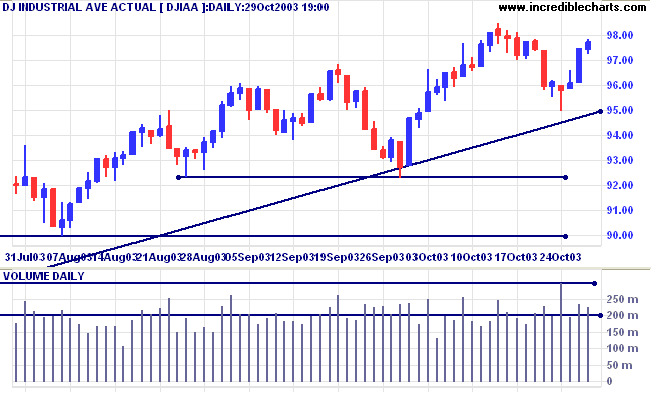
The Dow Industrial Average continued to rally, closing up 0.3% at
9775 on lower volume.
The intermediate down-trend is weak.
The primary trend is up. A fall below 9000 will signal reversal.
The intermediate down-trend is weak.
The primary trend is up. A fall below 9000 will signal reversal.
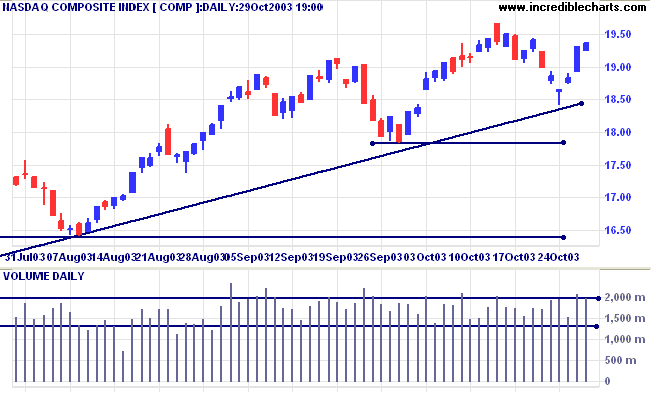
The Nasdaq Composite closed 5 points up at 1937 on continued
strong volume.
The intermediate down-trend appears weak.
The primary trend is up. A fall below 1640 will signal reversal.
The intermediate down-trend appears weak.
The primary trend is up. A fall below 1640 will signal reversal.
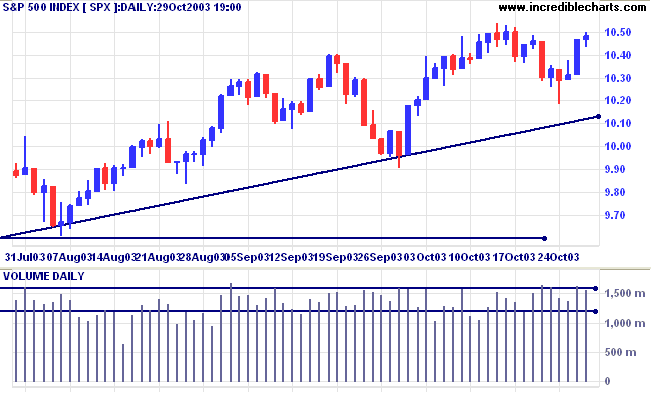
The S&P 500 gained 1 point to close at 1048. Strong volume
signals increased selling pressure.
The intermediate down-trend is weak.
The primary trend is up. A fall below 960 will signal reversal.
The intermediate down-trend is weak.
The primary trend is up. A fall below 960 will signal reversal.
The Chartcraft NYSE Bullish % Indicator increased
to 80.85% (October 29).
Market Strategy
Short-term: Bullish if the S&P500 is above 1054. Bearish below 1026.
Intermediate: Bullish above 1054.
Long-term: Bullish above 960.
Short-term: Bullish if the S&P500 is above 1054. Bearish below 1026.
Intermediate: Bullish above 1054.
Long-term: Bullish above 960.
Treasury yields
The yield on 10-year treasury notes recovered to close at 4.28%.
The intermediate trend is down.
The primary trend is up.
The yield on 10-year treasury notes recovered to close at 4.28%.
The intermediate trend is down.
The primary trend is up.
Gold
New York (20.08): Spot gold rebounded to $385.80.
The intermediate trend is up.
The primary trend is up. Expect resistance at 400 to 415.
New York (20.08): Spot gold rebounded to $385.80.
The intermediate trend is up.
The primary trend is up. Expect resistance at 400 to 415.
ASX Australia
The All Ordinaries followed the US market higher, closing 21
points up on average volume.
Initial support is at 3238 to 3250; resistance at 3317.
Initial support is at 3238 to 3250; resistance at 3317.
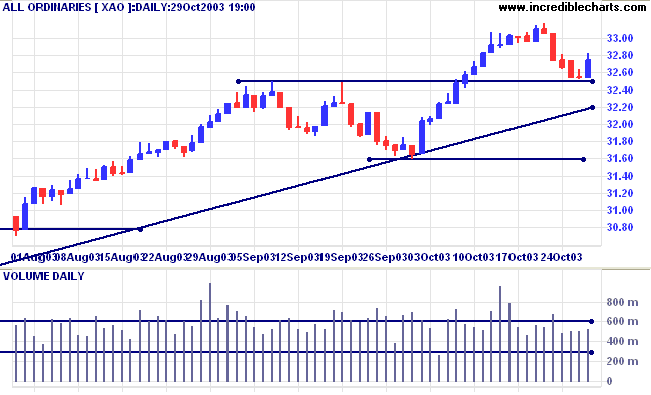
The intermediate up-trend is weak.
The primary trend is up. The rally is extended and the probability of a reversal increases with each successive primary trend movement.
A fall below 3160 will signal reversal.
MACD (26,12,9) is below its signal line; Slow Stochastic (20,3,3) is below; Twiggs Money Flow (100) is below its signal line and displays a bearish "triple" divergence.
Market Strategy
Short-term: Bullish if the All Ords is above 3317. Bearish below 3238.
Intermediate: Bullish above 3317.
Long-term: Bullish above 3160.
Short-term: Bullish if the All Ords is above 3317. Bearish below 3238.
Intermediate: Bullish above 3317.
Long-term: Bullish above 3160.
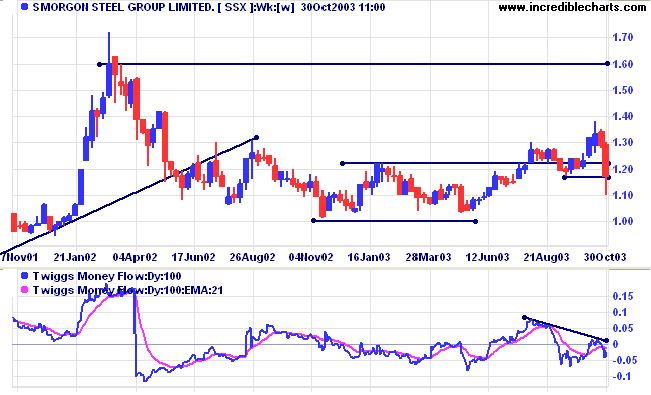
Smorgon [SSX]
Last covered October 15, 2003. SSX broke out of a broad base above 1.00 but Relative Strength failed to follow, turning down below the resistance level. Price has fallen sharply and RS has made a new low, below the previous trough.
Last covered October 15, 2003. SSX broke out of a broad base above 1.00 but Relative Strength failed to follow, turning down below the resistance level. Price has fallen sharply and RS has made a new low, below the previous trough.
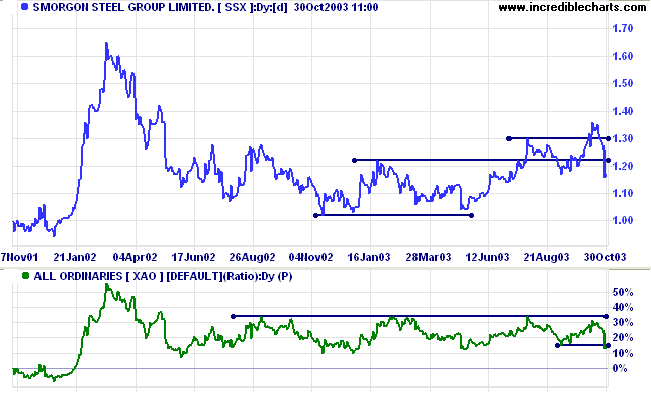
Twiggs Money Flow (100) has also turned down, displaying a
bearish divergence.
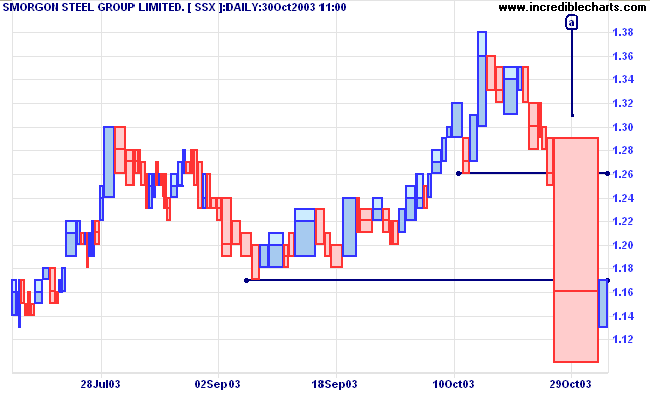
Equivolume highlights the enormous volume on the reversal at [a].
The weakish close reflects some buying support, but the overall
view is bearish.
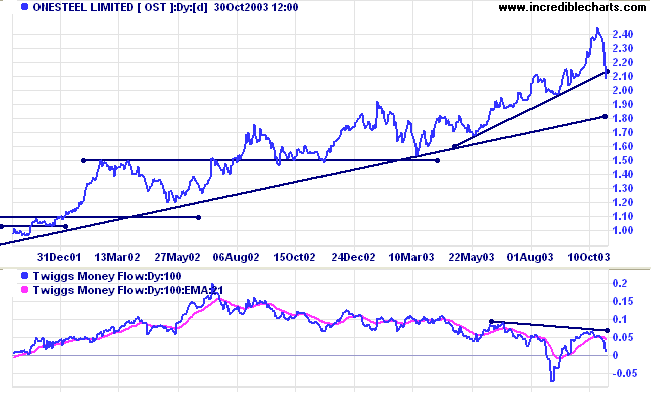
Onesteel [OST]
Last Covered August 20, 2002. Onesteel displays a similar bearish divergence on Twiggs Money Flow (100). Relative Strength (xao) appears to be weakening but has yet to make a new low.
Last Covered August 20, 2002. Onesteel displays a similar bearish divergence on Twiggs Money Flow (100). Relative Strength (xao) appears to be weakening but has yet to make a new low.
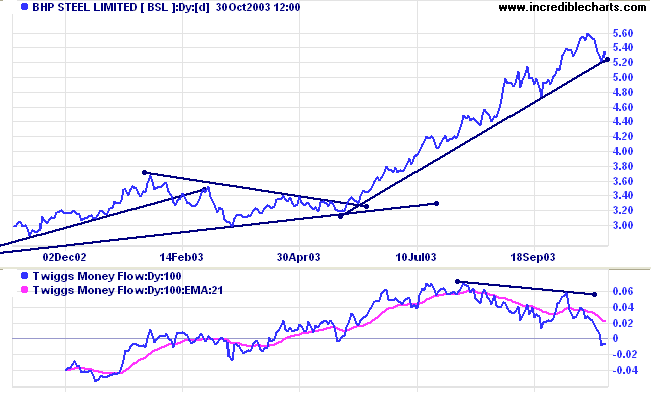
BHP Steel [BSL]
Twiggs Money Flow (100) displays a bearish divergence while Relative Strength (xao) has yet to make a new low.
Twiggs Money Flow (100) displays a bearish divergence while Relative Strength (xao) has yet to make a new low.
As SA Nelson puts it: "someone who is a large seller of a stock
does not go around with a brass band". Twiggs Money Flow and
Relative Strength are two useful tools for uncovering their
footprints.
Understanding
the Trading Diary has been expanded to offer further
assistance to readers, including
directions on how to search the archives.
Colin Twiggs
Do you trade for money or for the thrill?
Don't tell me, just show your trading records.
Don't have good records?
Well, that's an answer in itself.
~ Alexander Elder: Come Into My Trading Room
Don't tell me, just show your trading records.
Don't have good records?
Well, that's an answer in itself.
~ Alexander Elder: Come Into My Trading Room
Format Charts: Colors
|
To alter the color of captions or
trendlines: (1) select Format Charts >> Colors; (2) click on the color button next to Trendlines or Captions; (3) select a new color from the palette and click OK. |
Back Issues
You can now view back issues at the Daily Trading Diary Archives.
You can now view back issues at the Daily Trading Diary Archives.
Back Issues
Access the Trading Diary Archives.

Author: Colin Twiggs is a former investment banker with almost 40 years of experience in financial markets. He co-founded Incredible Charts and writes the popular Trading Diary and Patient Investor newsletters.
Using a top-down approach, Colin identifies key macro trends in the global economy before evaluating selected opportunities using a combination of fundamental and technical analysis.
Focusing on interest rates and financial market liquidity as primary drivers of the economic cycle, he warned of the 2008/2009 and 2020 bear markets well ahead of actual events.
He founded PVT Capital (AFSL No. 546090) in May 2023, which offers investment strategy and advice to wholesale clients.