|
ASX hourly updates Our data suppliers had problems with their servers in the US, causing us to miss the first two hourly updates on Thursday. Closing prices for the 17th were also briefly affected when the service was switched to a backup server. The normal service has resumed and we will continue to monitor the situation. |
Trading Diary
September 18, 2003
These extracts from my daily trading diary are
for educational purposes and should not be interpreted as
investment advice. Full terms and conditions can be found at
Terms
of Use .
USA
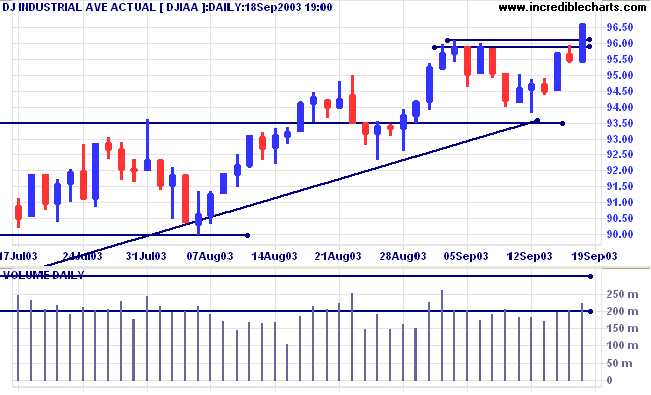
The Dow Industrial Average rallied 1.2%, breaking through
resistance to close at 9659.
The intermediate trend is up. Continued low volume signals weakness.
The primary trend is up.
The intermediate trend is up. Continued low volume signals weakness.
The primary trend is up.
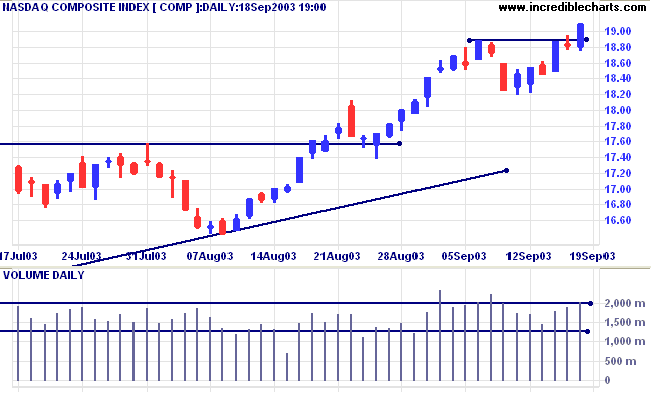
The Nasdaq Composite rallied 27 points to close at 1910 on strong
volume.
The intermediate trend is up.
The primary trend is up.
The intermediate trend is up.
The primary trend is up.
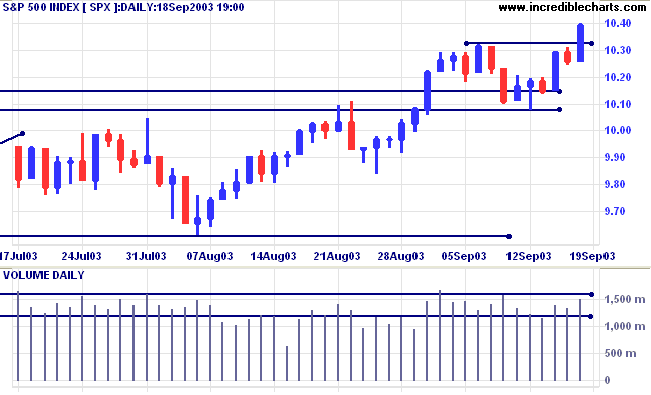
The S&P 500 rallied 14 points to close at 1040 on higher
volume.
The intermediate trend is up.
The primary trend is up.
The intermediate trend is up.
The primary trend is up.
The Chartcraft NYSE Bullish % Indicator has made
a new high of 80.89% (September 18).
Market Strategy
Short-term: Long if the S&P500 is above 1032.
Intermediate: Long if S&P 500 is above 1032.
Long-term: Long if the index is above 1015.
Short-term: Long if the S&P500 is above 1032.
Intermediate: Long if S&P 500 is above 1032.
Long-term: Long if the index is above 1015.
Jobless claims lower
New unemployment claims fell to 399,000 for last week. (more)
New unemployment claims fell to 399,000 for last week. (more)
Treasury yields
The yield on 10-year treasury notes closed lower at 4.18%, below support at 4.20%.
There is a further band of support below, at 4.00 to 4.10, so I do not yet expect a re-test of the previous lows.
The intermediate and primary trends are both up.
The yield on 10-year treasury notes closed lower at 4.18%, below support at 4.20%.
There is a further band of support below, at 4.00 to 4.10, so I do not yet expect a re-test of the previous lows.
The intermediate and primary trends are both up.
Gold
New York (20.22): Spot gold has rallied to $376.40.
The primary trend is up.
Price has broken above a symmetrical triangle formed since the start of the year. If gold rises above resistance at 382, the target is the 10-year high of 420.
New York (20.22): Spot gold has rallied to $376.40.
The primary trend is up.
Price has broken above a symmetrical triangle formed since the start of the year. If gold rises above resistance at 382, the target is the 10-year high of 420.
ASX Australia
The All Ordinaries rose slightly, gaining 3 points to close at
3225. Strong volume signals selling pressure ahead of resistance
at 3238 to 3250. Failure to break through resistance will signal
further consolidation.
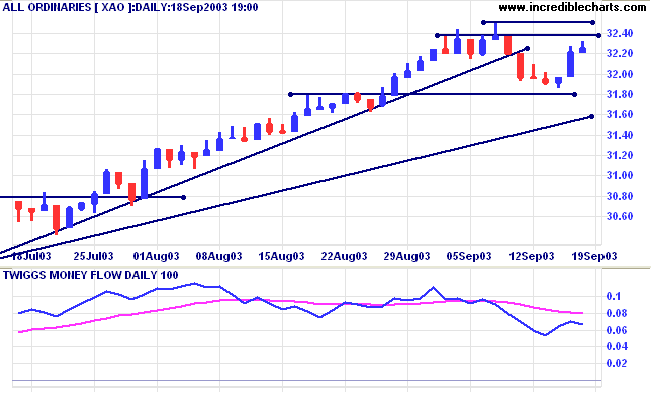
The intermediate trend is up but the index has broken its upward
trendline.
The primary trend is up.
MACD (26,12,9) is below its signal line; Slow Stochastic (20,3,3) has crossed to above;
Twiggs Money Flow is above zero, after a bearish divergence.
The primary trend is up.
MACD (26,12,9) is below its signal line; Slow Stochastic (20,3,3) has crossed to above;
Twiggs Money Flow is above zero, after a bearish divergence.
Market Strategy
Short-term: Long if the All Ords is above 3232.
Intermediate: Long if the index is above 3232.
Long-term: Long if the index is above 2978 .
Short-term: Long if the All Ords is above 3232.
Intermediate: Long if the index is above 3232.
Long-term: Long if the index is above 2978 .
Telecom NZ [TEL]
Last covered August 5, 2003.
TEL has formed a broad base, with Twiggs Money Flow (100) signaling strong accumulation over the past year. In the last 4 months price has consolidated just below resistance at the upper edge of the base, a bullish sign.
Last covered August 5, 2003.
TEL has formed a broad base, with Twiggs Money Flow (100) signaling strong accumulation over the past year. In the last 4 months price has consolidated just below resistance at the upper edge of the base, a bullish sign.
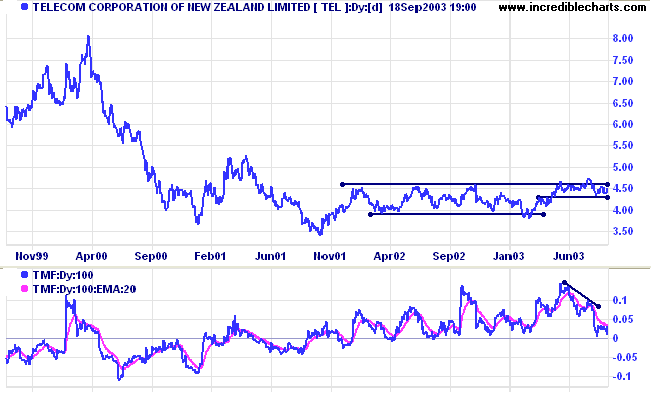
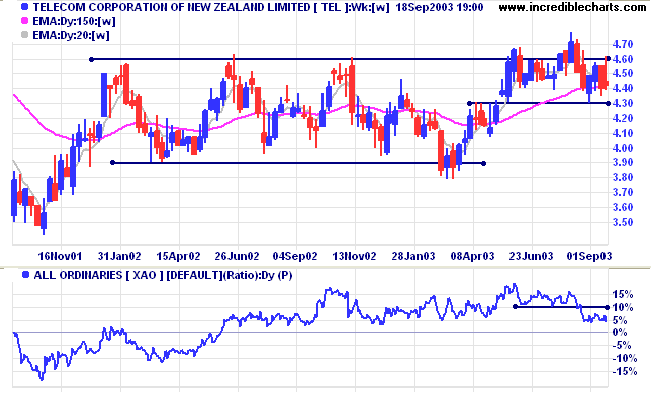
Relative Strength (price ratio: xao) has fallen, forming a new
3-month low.
Support has formed at 4.30, the high from April.
Support has formed at 4.30, the high from April.
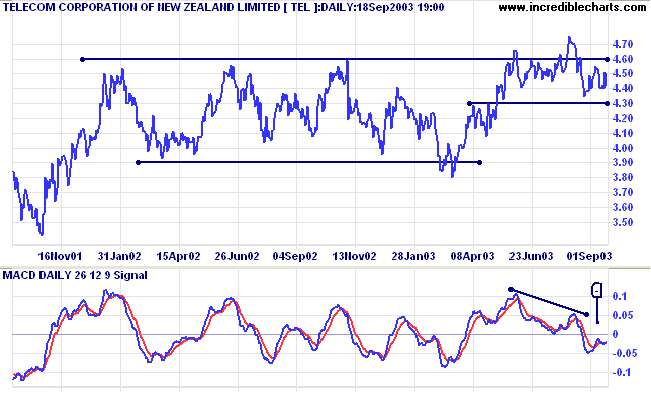
MACD shows a bearish divergence and a bearish peak below zero.
On the daily volume chart we can see false breaks above
resistance at [1] and [2] before a breakout on strong volume
which ended with a doji at [3]. This was followed by a two-thrust
correction down to [4]. Weak closes at [4] and [5] signaled
buying support and were followed by two further tests of
resistance at 4.60. The latest test at [6] showed up on my stock
screen: price gapped up at the opening, tested resistance and
then retreated all the way back to 4.40. The combination of a
key
reversal, a
wide-ranging day and high volume make a strong bear signal.
We can expect a thorough test of support at 4.35 to 4.30.
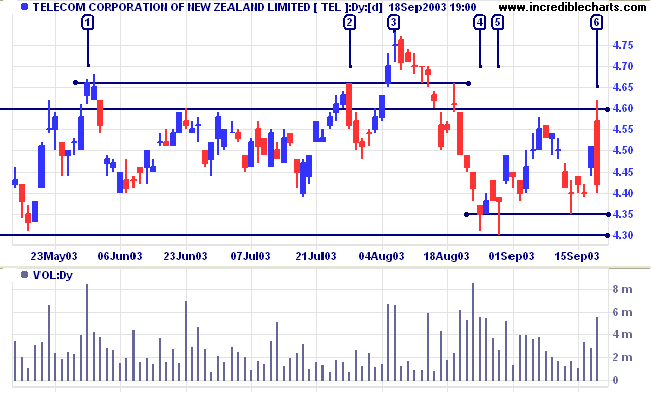
A rise above 4.60 would be bullish, whereas a fall below 4.30
will be a strong bear signal.
Aquarius Platinum [AQP]
After a marginal new high in mid-2002, AQP corrected back, in two steps, to 5.00. Price immediately rallied, forming an unstable V-bottom. Twiggs Money Flow (100) has risen above zero, to signal accumulation.
After a marginal new high in mid-2002, AQP corrected back, in two steps, to 5.00. Price immediately rallied, forming an unstable V-bottom. Twiggs Money Flow (100) has risen above zero, to signal accumulation.
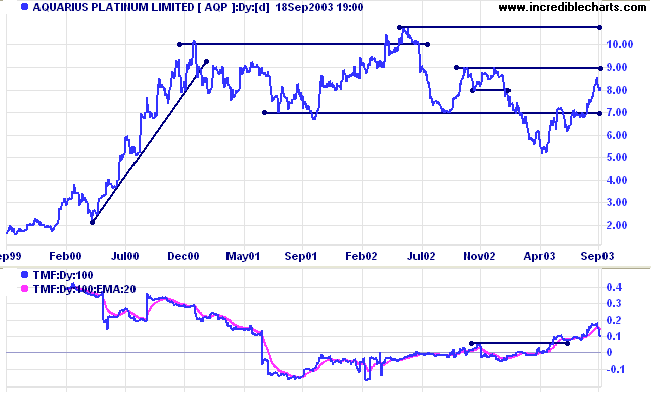
Relative Strength (price ratio: xao) has formed a new 3-month
high.
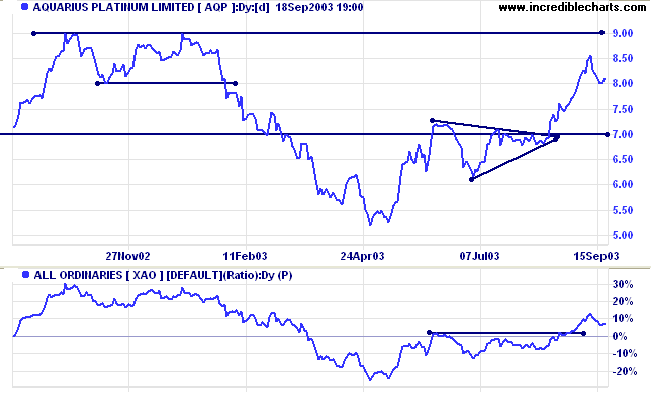
Note the narrow double bottom at the end of April, a strong intermediate bull signal. This was followed by consolidation around the 7.00 resistance level in the form of a symmetrical triangle.
Note the narrow double bottom at the end of April, a strong intermediate bull signal. This was followed by consolidation around the 7.00 resistance level in the form of a symmetrical triangle.
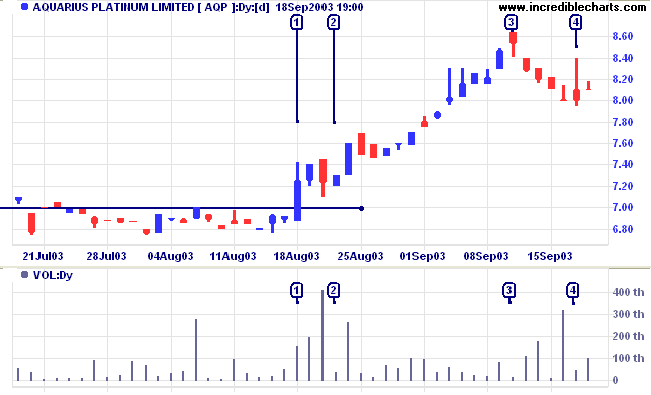
The daily volume chart shows the breakout above resistance on
strong volume at [1]. This was followed by a bonus at [2]: a very
short correction with a dry up of volume and
volatility.
A rather strange signal at [3]: price gapped up at the opening then retreated before again rallying to make a higher close. Volume gives a clue: there are no buyers. The correction takes too long, warning that the trend is changing, while the attempted rally at [4] fades on low volume. Sellers dominate and we may see a second leg down to test support at 7.60.
A rather strange signal at [3]: price gapped up at the opening then retreated before again rallying to make a higher close. Volume gives a clue: there are no buyers. The correction takes too long, warning that the trend is changing, while the attempted rally at [4] fades on low volume. Sellers dominate and we may see a second leg down to test support at 7.60.
A rise above the high of [3] would be bullish, while a fall below
7.60 will be a bear signal.
Longer-term support is at 7.00 and resistance at 9.00.
Longer-term support is at 7.00 and resistance at 9.00.
Understanding
the Trading Diary has been expanded to offer further
assistance to readers, including directions on how to search the
archives.
Colin Twiggs
It is more important to say "no" to an
opportunity, than to say "yes".
~ Warren Buffet.
~ Warren Buffet.
Searching Archives
|
You can now search the complete trading diary archives. All
the archives have been edited to include square brackets
around stock codes. Example: to search for BHP enter +"back issues" +[bhp] in the search field. |
Back Issues
You can now view back issues at the Daily Trading Diary Archives.
You can now view back issues at the Daily Trading Diary Archives.
Back Issues
Access the Trading Diary Archives.

Author: Colin Twiggs is a former investment banker with almost 40 years of experience in financial markets. He co-founded Incredible Charts and writes the popular Trading Diary and Patient Investor newsletters.
Using a top-down approach, Colin identifies key macro trends in the global economy before evaluating selected opportunities using a combination of fundamental and technical analysis.
Focusing on interest rates and financial market liquidity as primary drivers of the economic cycle, he warned of the 2008/2009 and 2020 bear markets well ahead of actual events.
He founded PVT Capital (AFSL No. 546090) in May 2023, which offers investment strategy and advice to wholesale clients.