|
ETOs and Warrants We have not forgotten about ETOs and warrants. We just had to make a detour first: we encountered problems with the larger menu sizes and had to re-build the securities and watchlist menus to cope. This has now been completed, with version 4.0.2.500, and we hope to have news for you shortly. I have learnt that the words "this will not take more than a week" should not be taken literally when developing software. |
Trading Diary
September 17, 2003
These extracts from my daily trading diary are
for educational purposes and should not be interpreted as
investment advice. Full terms and conditions can be found at
Terms
of Use .
USA
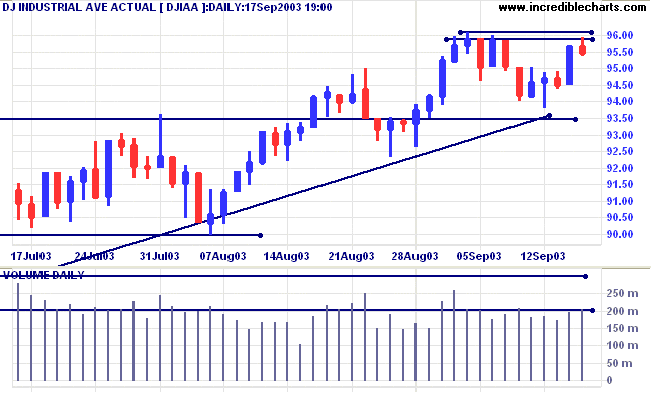
The Dow Industrial Average eased slightly to 9546 on low volume.
The difficulty in breaking the first band of resistance increases
the likelihood of further consolidation between 9600 and
9350.
The intermediate trend is up. Continued low volume signals weakness.
The primary trend is up.
The intermediate trend is up. Continued low volume signals weakness.
The primary trend is up.
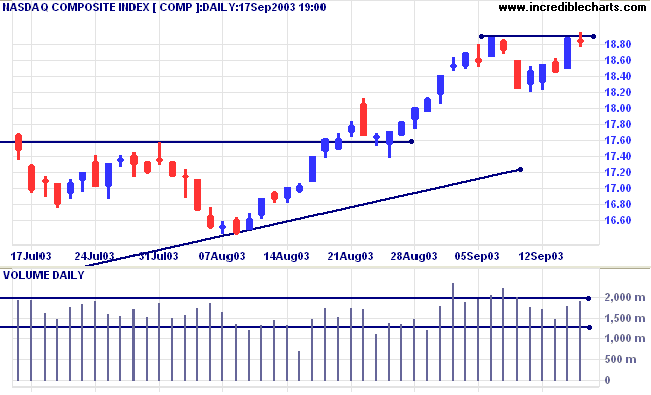
The Nasdaq Composite also struggled to break above the previous
high, closing down 4 points at 1883 on higher volume.
The intermediate trend is up.
The primary trend is up.
The intermediate trend is up.
The primary trend is up.
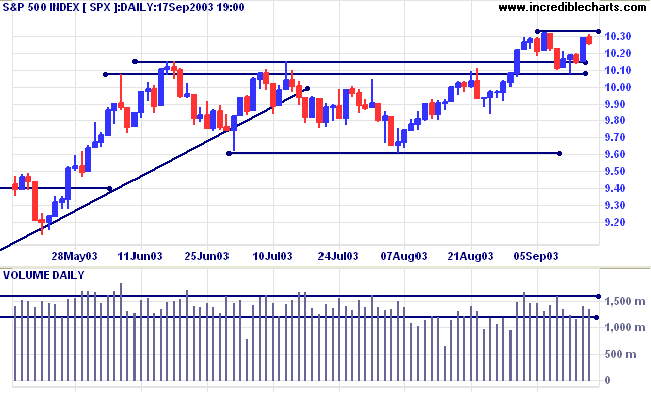
The S&P 500 also appears to be slowing to, what Bill McLaren
would call a creeping up-trend. The index fell 3 points to
close at 1026 on higher volume.
The intermediate trend is up.
The primary trend is up.
The intermediate trend is up.
The primary trend is up.
The Chartcraft NYSE Bullish % Indicator has made
a new high of 80.40% (September 17).
Market Strategy
Short-term: Long if the S&P500 is above 1032.
Intermediate: Long if S&P 500 is above 1032.
Long-term: Long is the index is above 960.
Short-term: Long if the S&P500 is above 1032.
Intermediate: Long if S&P 500 is above 1032.
Long-term: Long is the index is above 960.
Deficit continues to grow
The US budget deficit passes $400 billion for the first time. (more)
The US budget deficit passes $400 billion for the first time. (more)
Treasury yields
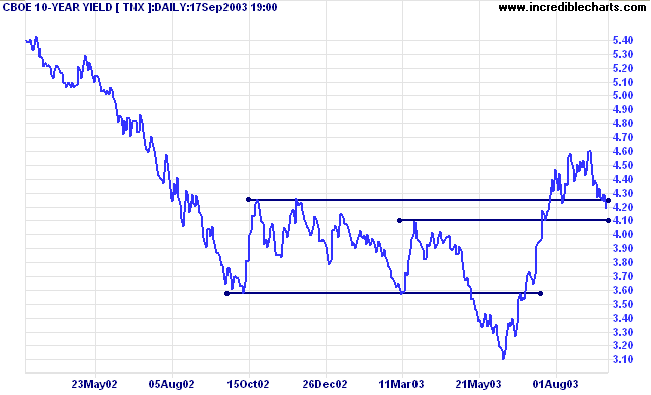
The yield on 10-year treasury notes closed down at 4.19%, below support at 4.20%.
There is a further band of support below, at 4.00 to 4.10, so I do not yet expect a re-test of the previous lows.
The intermediate and primary trends are both up.
The yield on 10-year treasury notes closed down at 4.19%, below support at 4.20%.
There is a further band of support below, at 4.00 to 4.10, so I do not yet expect a re-test of the previous lows.
The intermediate and primary trends are both up.
Gold
New York (21.30): Spot gold has rallied to $376.90.
The primary trend is up.
Price has broken above a symmetrical triangle formed since the start of the year. If gold rises above resistance at 382, the target is the 10-year high of 420.
New York (21.30): Spot gold has rallied to $376.90.
The primary trend is up.
Price has broken above a symmetrical triangle formed since the start of the year. If gold rises above resistance at 382, the target is the 10-year high of 420.
ASX Australia
The All Ordinaries rallied 25 points to close at 3222 on average
volume. The rally faces a band of resistance from 3238 to 3250. A
rise above the band will signal continuation of the strong
up-trend; failure to break through the band will signal further
consolidation.
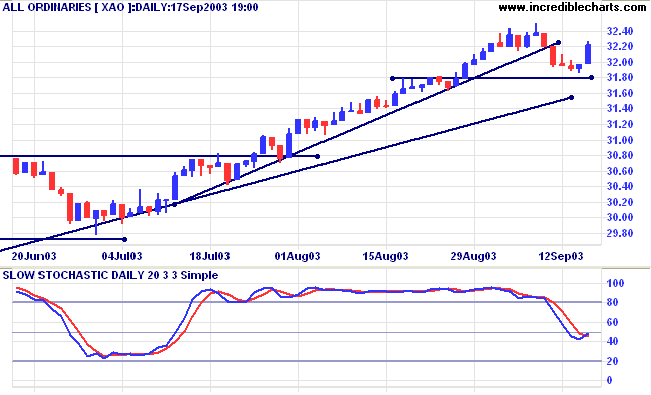
The intermediate trend is up but the index has broken its upward
trendline.
The primary trend is up.
MACD (26,12,9) is below its signal line; Slow Stochastic (20,3,3) has crossed to above;
Twiggs Money Flow has crossed back above zero, after a bearish divergence.
The primary trend is up.
MACD (26,12,9) is below its signal line; Slow Stochastic (20,3,3) has crossed to above;
Twiggs Money Flow has crossed back above zero, after a bearish divergence.
Market Strategy
Short-term: Long above 3202.
Intermediate: Long if the index is above 3180.
Long-term: Long if the index is above 2978 .
Short-term: Long above 3202.
Intermediate: Long if the index is above 3180.
Long-term: Long if the index is above 2978 .
Coca Cola Amatil [CCL]
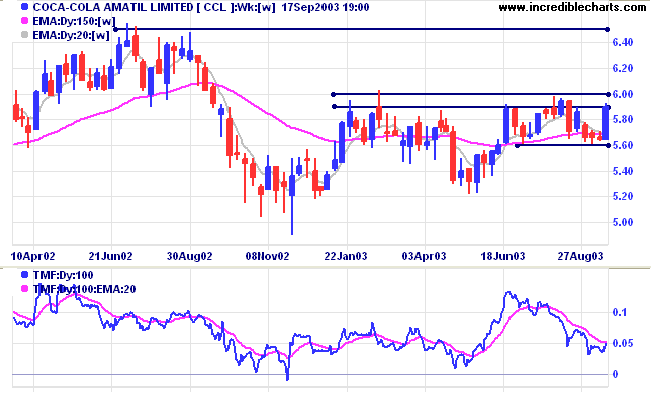
CCL formed a narrow inverted head and shoulders reversal at the end of 2002 before rallying to 6.00. Price then corrected back to re-test support (note that support formed at the level of the right shoulder) before again rallying to test 6.00. The stock is now consolidating between 5.60 and 6.00.
Twiggs Money Flow (100) signals accumulation, while the 21-day indicator has crossed above its downward trendline, a bullish sign.
MACD is neutral, crossing above its signal line while below zero.
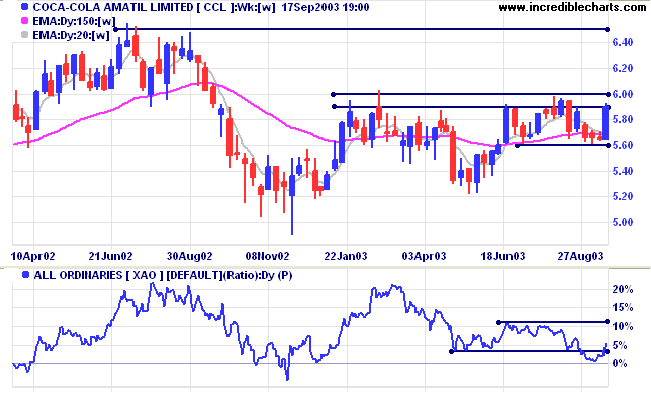
Relative Strength (price ratio: xao) shows considerable weakness
over the past 6 months, forming new 3-month lows.
The indicator has now crossed back above support. A higher low will be a bullish sign, while a 3-month high will be a stronger signal.
The indicator has now crossed back above support. A higher low will be a bullish sign, while a 3-month high will be a stronger signal.
Equivolume shows a band of overhead resistance between 5.90 and
6.00.
Tests of resistance have so far lacked commitment, evidenced by thin volume. The latest gap up is also likely to exhaust momentum.
Heavy volumes confirm the strength of the support level at 5.62/5.65.
Tests of resistance have so far lacked commitment, evidenced by thin volume. The latest gap up is also likely to exhaust momentum.
Heavy volumes confirm the strength of the support level at 5.62/5.65.
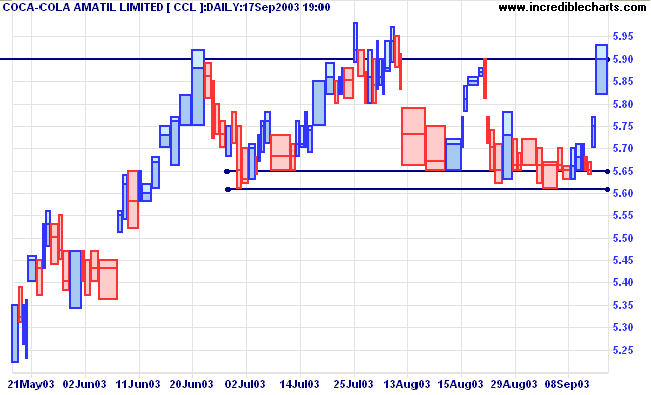
A rise above 6.00 will be bullish.
A fall below 5.62 would be bearish.
A fall below 5.62 would be bearish.
An example of how to use the rail tracks:
To go long, place a buy-stop just above 6.00, with a stop-loss just below 5.90.
To go short, place a sell-stop below 5.62, with a stop-loss just above 5.65.
To go long, place a buy-stop just above 6.00, with a stop-loss just below 5.90.
To go short, place a sell-stop below 5.62, with a stop-loss just above 5.65.
Understanding
the Trading Diary has been expanded to offer further
assistance to readers, including directions on how to search the
archives.
Colin Twiggs
There is a theory which states that if ever
anyone discovers exactly what the Universe is for and why it is
here,
it will instantly disappear and be replaced by something even more bizarre and inexplicable.
There is another theory which states that this has already happened.
~ Douglas Noel Adams: Hitchhiker's Guide to the Galaxy.
it will instantly disappear and be replaced by something even more bizarre and inexplicable.
There is another theory which states that this has already happened.
~ Douglas Noel Adams: Hitchhiker's Guide to the Galaxy.
Display Partially-completed Weeks or Months
|
To display partially completed weeks or months on the price
chart and to show weekly or monthly indicator values for an
incomplete period: select File >> Advanced Features >> Display Part-Periods. See Display Part Periods for further details. |
Back Issues
You can now view back issues at the Daily Trading Diary Archives.
You can now view back issues at the Daily Trading Diary Archives.
Back Issues
Access the Trading Diary Archives.

Author: Colin Twiggs is a former investment banker with almost 40 years of experience in financial markets. He co-founded Incredible Charts and writes the popular Trading Diary and Patient Investor newsletters.
Using a top-down approach, Colin identifies key macro trends in the global economy before evaluating selected opportunities using a combination of fundamental and technical analysis.
Focusing on interest rates and financial market liquidity as primary drivers of the economic cycle, he warned of the 2008/2009 and 2020 bear markets well ahead of actual events.
He founded PVT Capital (AFSL No. 546090) in May 2023, which offers investment strategy and advice to wholesale clients.