|
Incredible Charts version
4.0.2.500 The new version is now available. Check Help>>About to ensure that your software has been automatically updated. The update offers further improvements to the watchlist menu, powerful new scrolling features and supports the use of Large Font settings on laptop (and desktop) computers. See What's New? for further details. |
Trading Diary
September 16, 2003
These extracts from my daily trading diary are
for educational purposes and should not be interpreted as
investment advice. Full terms and conditions can be found at
Terms
of Use .
USA
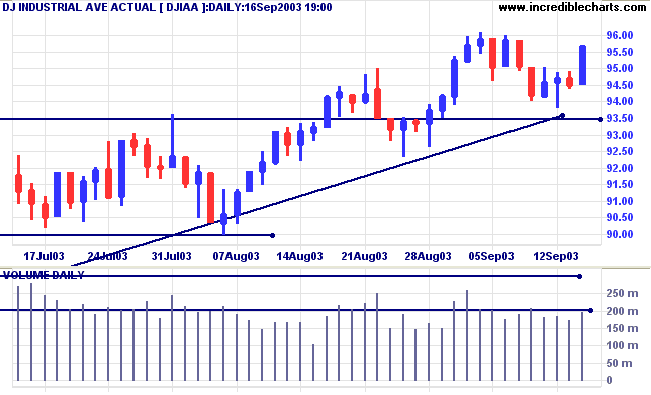
The Dow Industrial Average rallied 1.2% to 9567 on low
volume.
The intermediate trend is up. Continued low volume signals weakness.
The primary trend is up.
The intermediate trend is up. Continued low volume signals weakness.
The primary trend is up.
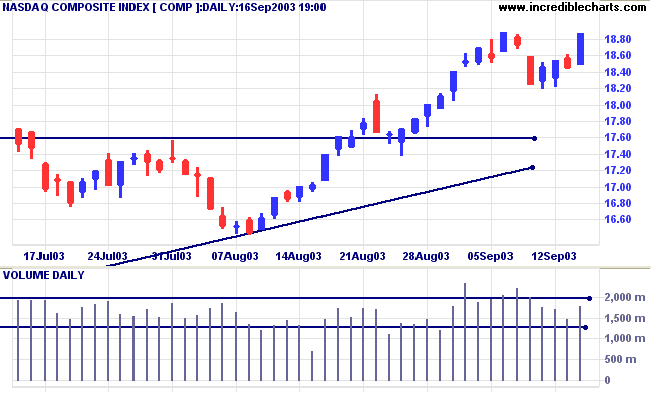
The Nasdaq Composite jumped 41 points to close at 1887 on higher
volume. A rise above 1860 signals resumption of the fast
up-trend.
The intermediate trend is up.
The primary trend is up.
The intermediate trend is up.
The primary trend is up.
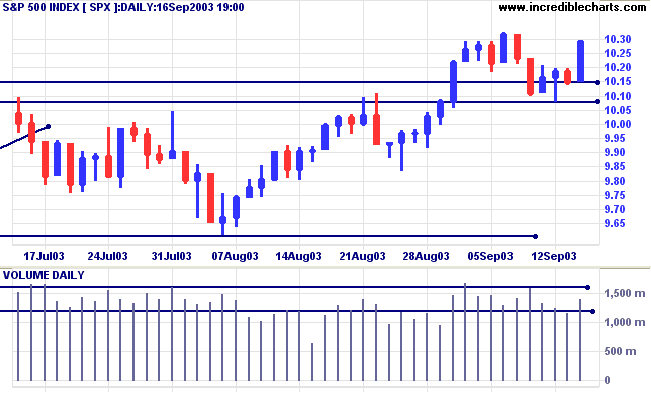
The S&P 500 rallied strongly, gaining 14 points to close at
1029 on higher volume.
The intermediate trend is up.
The primary trend is up.
The intermediate trend is up.
The primary trend is up.
The Chartcraft NYSE Bullish % Indicator is at
80.18% (September 16).
Market Strategy
Short-term: Long if the S&P500 is above 1023.
Intermediate: Long if S&P 500 is above 1023.
Long-term: Long is the index is above 960.
Short-term: Long if the S&P500 is above 1023.
Intermediate: Long if S&P 500 is above 1023.
Long-term: Long is the index is above 960.
Fed leaves rates alone
The Fed left rates unchanged and appears prepared to keep them low for some time. (more)
The Fed left rates unchanged and appears prepared to keep them low for some time. (more)
Treasury yields
The yield on 10-year treasury notes closed at 4.29%, above support at 4.20%.
The intermediate and primary trends are both up.
The yield on 10-year treasury notes closed at 4.29%, above support at 4.20%.
The intermediate and primary trends are both up.
Gold
New York (21.11): Spot gold eased to $372.90.
The primary trend is up.
Price has broken above a symmetrical triangle formed since the start of the year. If gold rises above resistance at 382, the target is the 10-year high of 420.
New York (21.11): Spot gold eased to $372.90.
The primary trend is up.
Price has broken above a symmetrical triangle formed since the start of the year. If gold rises above resistance at 382, the target is the 10-year high of 420.
ASX Australia
The All Ordinaries closed up 5 points at 3197 on higher volume.
The correction appears to be bottoming above support at 3180,
signaling trend strength.
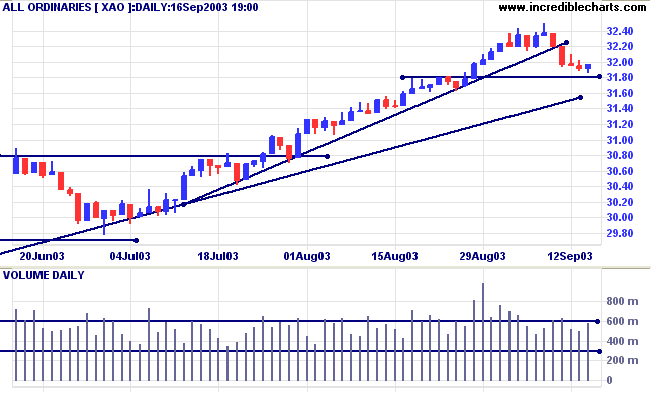
The intermediate trend is up but the index has broken its upward
trendline.
The primary trend is up.
MACD (26,12,9) is below its signal line; Slow Stochastic (20,3,3) is below;
Twiggs Money Flow has crossed back above zero, after a bearish divergence.
The primary trend is up.
MACD (26,12,9) is below its signal line; Slow Stochastic (20,3,3) is below;
Twiggs Money Flow has crossed back above zero, after a bearish divergence.
Market Strategy
Short-term: Long above 3202.
Intermediate: Long if the index is above 3160.
Long-term: Long if the index is above 2978 .
Short-term: Long above 3202.
Intermediate: Long if the index is above 3160.
Long-term: Long if the index is above 2978 .
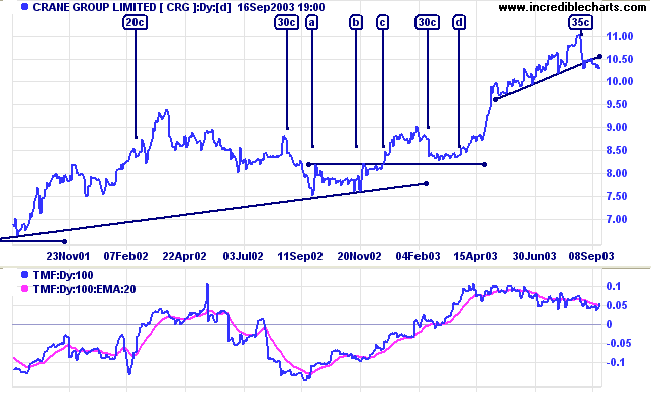
Crane Group [CRG]
This industrial machinery stock staged a strong rally in 2001/2002 before entering a lengthy consolidation which ended with a breakout at [c]. The dividend ex-dates are shown as [20c], [30c], etc.
Price formed a rectangle at [a] to [b], with equal highs and equal lows, before consolidating just below resistance, between [b] and [c], a bullish sign. Price then broke through resistance at [c], rallying to 9.00.
The stock then went ex on a 30 cent dividend, giving the appearance of a pull-back on the chart. In fact this was a sideways consolidation, another bullish signal, with a breakout at [d].
Twiggs Money Flow (100) has by this stage crossed above zero to add further weight to the bull signal.
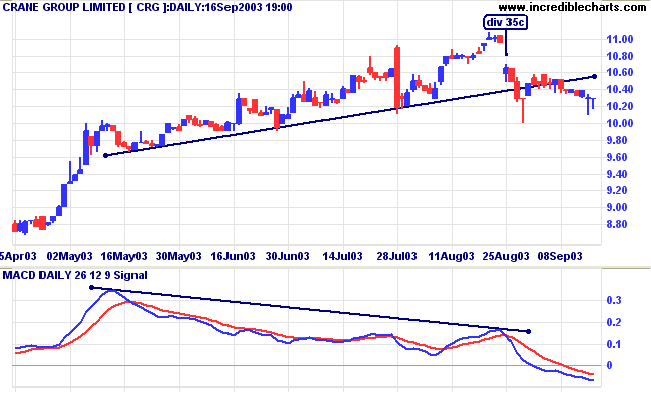
CRG rallies sharply after [d] before rolling over, in early May,
into a slower, more sustainable up-trend.
Another dividend ex-date on August 25 causes an artificial break of the trendline.
MACD shows a bearish divergence and Relative Strength shows an artificial fall.
Another dividend ex-date on August 25 causes an artificial break of the trendline.
MACD shows a bearish divergence and Relative Strength shows an artificial fall.
Equivolume shows that strong support can be expected at the low
of [1] because of heavy volume at this level. After the ex-date,
this translates to 9.90/9.80.
In fact, strong support is evident above that, at 10.30/10.00, with very weak closes at [3] and [4].
In fact, strong support is evident above that, at 10.30/10.00, with very weak closes at [3] and [4].
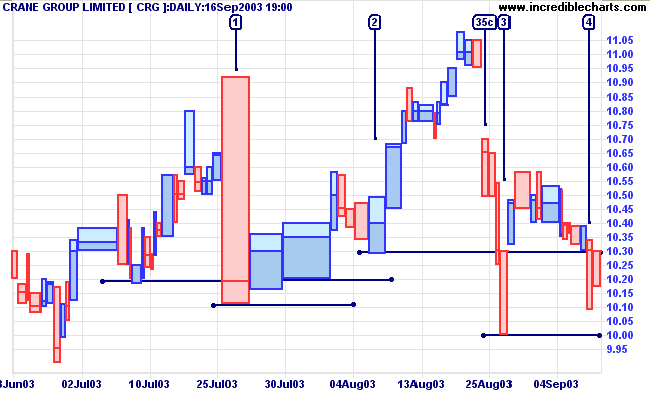
If price holds above 10.00, this will signal continuation of the
up-trend.
A fall below 10.00 would be bearish.
A fall below 10.00 would be bearish.
We had a lengthy discussion on the Chart Forum as to how to treat dividends. There appear to be three
camps:
But first, we have to obtain a reliable source of dividend history.
- Adjust past price history, the same as you would for any
other dilution factor.
This method is applied by yahoo on their charts. - Add the dividend to the price, as is done with an accumulation index.
- Make no adjustment, just disclose the dividend by way of note or caption.
But first, we have to obtain a reliable source of dividend history.
Understanding
the Trading Diary has been expanded to offer further
assistance to readers, including directions on how to search the
archives.
Colin Twiggs
Character is like a tree and reputation like its
shadow.
The shadow is what we think of it; the tree is the real thing.
~ Abraham Lincoln.
The shadow is what we think of it; the tree is the real thing.
~ Abraham Lincoln.
Email Charts
|
If you use Microsoft Outlook, rather than Outlook Express,
as your default email client: select File >> Advanced Features >> Send Email with Outlook. See Help: Email Charts for further details. |
Back Issues
You can now view back issues at the Daily Trading Diary Archives.
You can now view back issues at the Daily Trading Diary Archives.
Back Issues
Access the Trading Diary Archives.

Author: Colin Twiggs is a former investment banker with almost 40 years of experience in financial markets. He co-founded Incredible Charts and writes the popular Trading Diary and Patient Investor newsletters.
Using a top-down approach, Colin identifies key macro trends in the global economy before evaluating selected opportunities using a combination of fundamental and technical analysis.
Focusing on interest rates and financial market liquidity as primary drivers of the economic cycle, he warned of the 2008/2009 and 2020 bear markets well ahead of actual events.
He founded PVT Capital (AFSL No. 546090) in May 2023, which offers investment strategy and advice to wholesale clients.