|
Incredible Charts version
4.0.2.500 The new version is now available. Check Help>>About to ensure that your software has been automatically updated. The update offers further improvements to the watchlist menu, powerful new scrolling features and supports the use of Large Font settings on laptop (and desktop) computers. See What's New? for further details. |
Trading Diary
September 15, 2003
These extracts from my daily trading diary are
for educational purposes and should not be interpreted as
investment advice. Full terms and conditions can be found at
Terms
of Use .
USA
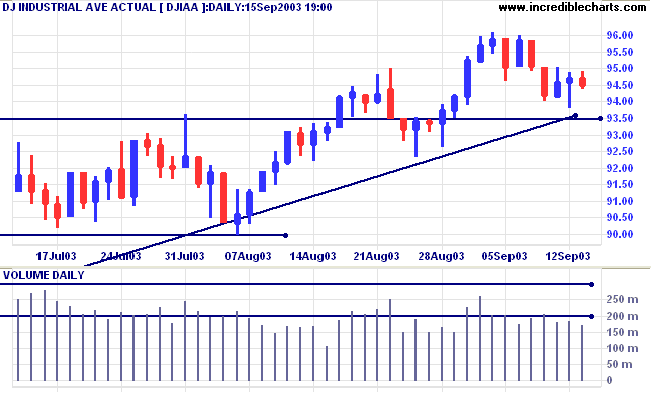
The Dow Industrial Average closed down 0.2% at 9449 on low
volume.
The intermediate trend is up. Continued low volume signals weakness.
The primary trend is up.
The intermediate trend is up. Continued low volume signals weakness.
The primary trend is up.
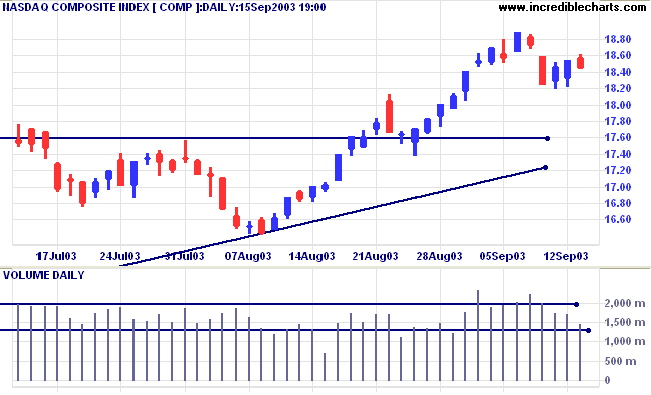
The Nasdaq Composite closed 9 points down at 1846 on lower
volume. A rise above 1860 will signal resumption of the fast
up-trend.
The intermediate trend is up.
The primary trend is up.
The intermediate trend is up.
The primary trend is up.
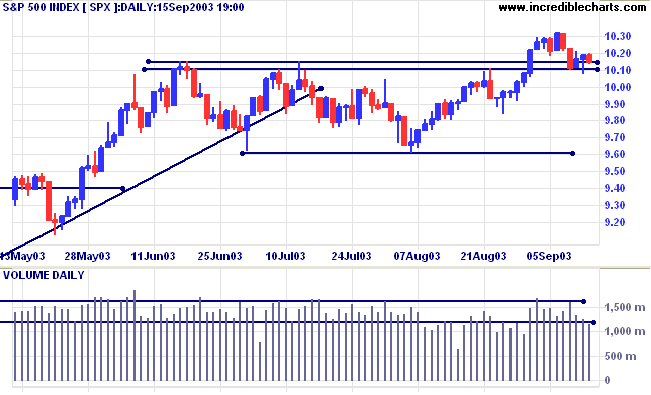
The S&P 500 closed down 4 points at 1015 on low volume,
testing support.
The intermediate trend is up.
The primary trend is up.
The intermediate trend is up.
The primary trend is up.
The Chartcraft NYSE Bullish % Indicator is at
79.78% (September 12).
Market Strategy
Short-term: Long if the S&P500 is above 1023.
Intermediate: Long if S&P 500 is above 1023.
Long-term: Long is the index is above 960.
Short-term: Long if the S&P500 is above 1023.
Intermediate: Long if S&P 500 is above 1023.
Long-term: Long is the index is above 960.
Fed meeting Tuesday
Few expect a rate cut from the Tuesday meeting. But the Fed faces some tough choices. (more)
Few expect a rate cut from the Tuesday meeting. But the Fed faces some tough choices. (more)
Treasury yields
The yield on 10-year treasury notes closed at 4.25%, testing support at 4.20%.
The intermediate and primary trends are both up.
The yield on 10-year treasury notes closed at 4.25%, testing support at 4.20%.
The intermediate and primary trends are both up.
Gold
New York (13.30): Spot gold is steady at $375.10 after repeated tests of resistance at 382.
The primary trend is up.
Price has broken above a symmetrical triangle formed since the start of the year. If gold rises above resistance at 382, the target is the 10-year high of 420.
New York (13.30): Spot gold is steady at $375.10 after repeated tests of resistance at 382.
The primary trend is up.
Price has broken above a symmetrical triangle formed since the start of the year. If gold rises above resistance at 382, the target is the 10-year high of 420.
ASX Australia
The All Ordinaries closed 3 points lower at 3192. Lower volume
and a narrow range signal that the correction is slowing. If the
index holds above support at 3180, this will signal continuation
of the fast up-trend.
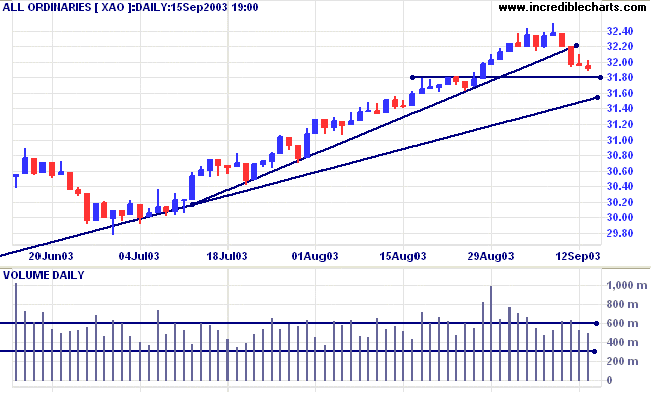
The intermediate trend is up but the index has broken its upward
trendline.
The primary trend is up.
MACD (26,12,9) has crossed to below its signal line; Slow Stochastic (20,3,3) is below;
Twiggs Money Flow has crossed to below zero, after a bearish divergence.
The primary trend is up.
MACD (26,12,9) has crossed to below its signal line; Slow Stochastic (20,3,3) is below;
Twiggs Money Flow has crossed to below zero, after a bearish divergence.
Market Strategy
Short-term: Long above 3202.
Intermediate: Long if the index is above 3160.
Long-term: Long if the index is above 2978 .
Short-term: Long above 3202.
Intermediate: Long if the index is above 3160.
Long-term: Long if the index is above 2978 .
Double bottoms
I have always followed the maxim: the wider the base, the stronger the signal. But Thomas Bulkowski (Encyclopedia of Chart Patterns) points out that narrow double bottoms have a lower failure rate, when measured prior to breakout, than broader ones. He even extends this to what he calls horns: double-bottom patterns that form over no more than 3 weeks. Two such patterns popped up in my stock screens for wide-ranging days:
I have always followed the maxim: the wider the base, the stronger the signal. But Thomas Bulkowski (Encyclopedia of Chart Patterns) points out that narrow double bottoms have a lower failure rate, when measured prior to breakout, than broader ones. He even extends this to what he calls horns: double-bottom patterns that form over no more than 3 weeks. Two such patterns popped up in my stock screens for wide-ranging days:
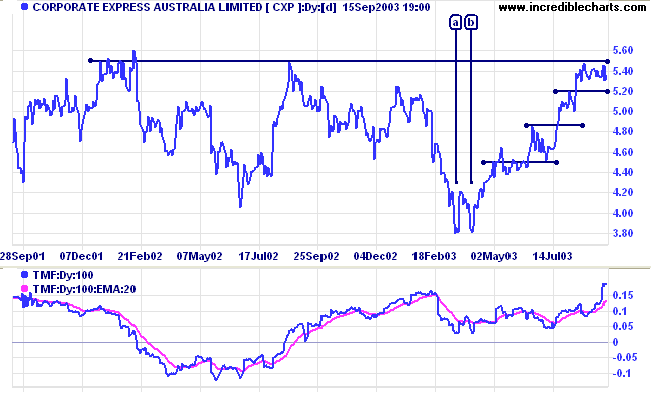
Corporate Express [CXP] formed a narrow double bottom at [a] and
[b], signaling the start of a strong rally.
Price has now consolidated below resistance at 5.50, a bullish signal. Because of the number of false breaks, I prefer to accumulate at least 1/3 of a position on such a bullish consolidation, prior to the breakout, if there is a dry-up of volume or volatility near the support level. Tight stops can be placed just below support.
Price has now consolidated below resistance at 5.50, a bullish signal. Because of the number of false breaks, I prefer to accumulate at least 1/3 of a position on such a bullish consolidation, prior to the breakout, if there is a dry-up of volume or volatility near the support level. Tight stops can be placed just below support.
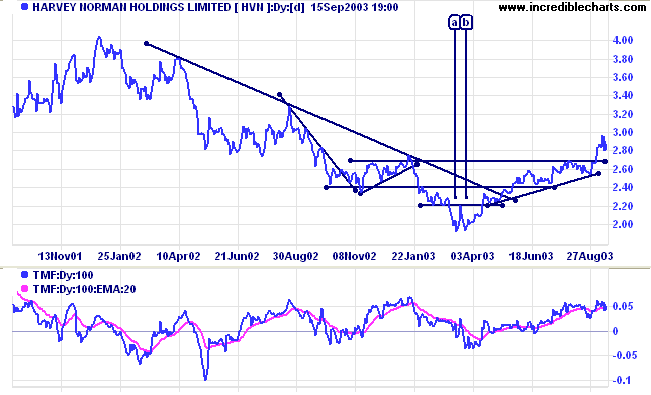
Harvey Norman [HVN] completed a similar narrow double bottom at
[a] and [b] below.
Price has now broken through resistance at 2.50 and may present an opportunity for traders to increase their positions on a pull-back to test the new support level.
Price has now broken through resistance at 2.50 and may present an opportunity for traders to increase their positions on a pull-back to test the new support level.
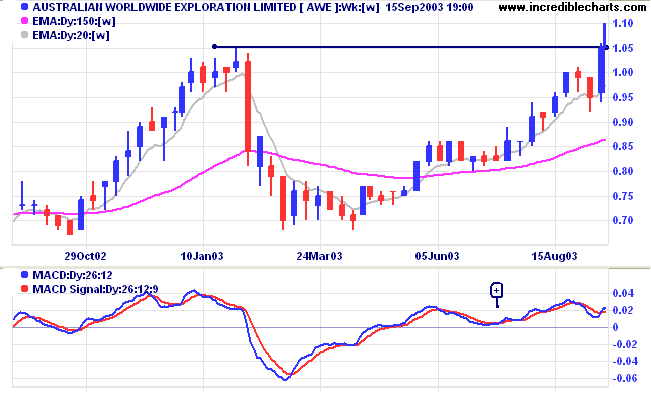
Australia Worldwide Exploration [AWE]
AWE presents a problem often faced by chartists: where will resistance form? There are three choices: (1) at the previous high of 1.05; (2) at the highest close of 1.02; or (3) at the round number of 1.00.
AWE presents a problem often faced by chartists: where will resistance form? There are three choices: (1) at the previous high of 1.05; (2) at the highest close of 1.02; or (3) at the round number of 1.00.
If we zoom in on the daily equivolume chart at the previous peak,
we see that volume was fairly evenly distributed between 1.00 and
1.02, with little changing hands at 1.05. So, the strongest
resistance level is likely to be the round number: 1.00.
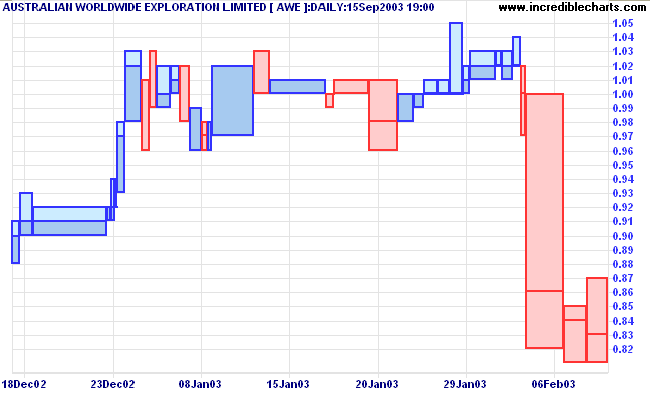
On the daily volume chart we see further evidence of
support/resistance forming in a narrow band, rather than at a
single line.
From the early 2003 peak, we know that resistance is likely to be strongest at 1.00. Price encounters some resistance with a false break at [1], and again at [5], before the eventual breakout on strong volume. But further resistance is then encountered at 1.05, the high from the previous peak, with strong volume and a very weak close at [6].
What we have is support/resistance forming at two closely related levels, like the two lines of a railway track: the lower line of resistance from the highest close or round number of the previous peak; the upper line forming at the highest high of the previous peak.
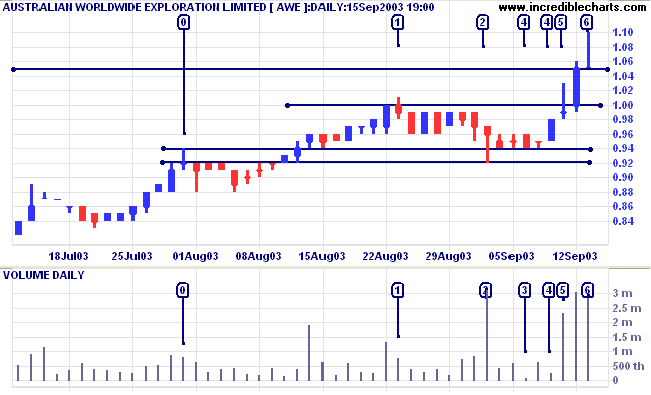
The same pattern forms in the shorter term. If we look at [0],
the high is at 0.94 but the highest close is at 0.92. When price
retests support, we find a break below 0.94 at [2] but selling
halts at 0.92 with strong buying forcing a weak close at 0.96.
Thereafter price respects the upper line of support at
0.94.
This railway track view of support/resistance can be very useful when placing stops. Always select the most extreme line: the higher line when placing a stop above resistance; and the lower line when placing stops below support.
It appears that AWE will consolidate between 1.00 and 1.05, a bullish sign. A breakout above 1.05 will be a further bull signal, while a fall below 1.00 would be bearish.
Understanding
the Trading Diary has been expanded to offer further
assistance to readers, including directions on how to search the
archives.
Colin Twiggs
To grasp an opportunity with firm decision marks
an able man.
~ SA Nelson: The ABC of Stock Speculation (1903).
~ SA Nelson: The ABC of Stock Speculation (1903).
Stock Screens: Wide Ranging Days
|
I have mentioned this before, but it bears repeating. My
favorite stock screen is for wide-ranging days which are
evident at most breakouts and reversals. I screen the ASX
200 with two filters: (1) Volatility Ratio (Schwager), which highlights stocks where True Range is at least twice the Average True Range for the last 14 days; and (2) Volume Spikes, where volume is at least 1.5 times the 50-day volume moving average. (3) Time periods, I normally set to 3 days, to capture only the most recent signals. |
Back Issues
You can now view back issues at the Daily Trading Diary Archives.
You can now view back issues at the Daily Trading Diary Archives.
Back Issues
Access the Trading Diary Archives.

Author: Colin Twiggs is a former investment banker with almost 40 years of experience in financial markets. He co-founded Incredible Charts and writes the popular Trading Diary and Patient Investor newsletters.
Using a top-down approach, Colin identifies key macro trends in the global economy before evaluating selected opportunities using a combination of fundamental and technical analysis.
Focusing on interest rates and financial market liquidity as primary drivers of the economic cycle, he warned of the 2008/2009 and 2020 bear markets well ahead of actual events.
He founded PVT Capital (AFSL No. 546090) in May 2023, which offers investment strategy and advice to wholesale clients.