|
Incredible Charts version
4.0.2.500 The new version has been held back a day or two for further testing. The update offers further improvements to the watchlist menu, powerful new scrolling features and supports the use of Large Font settings on laptop (and desktop) computers. |
Trading Diary
September 8, 2003
These extracts from my daily trading diary
are for educational purposes
only and should not be
interpreted as investment advice. Full terms and conditions can
be found at Terms
of Use .
USA
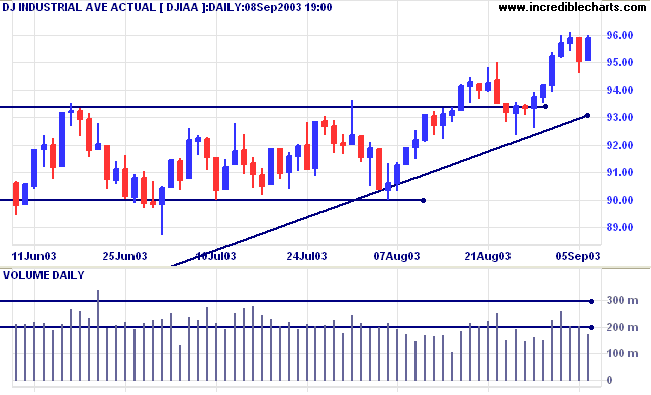
The Dow Industrial Average regained Friday's losses to close at
9586. Low volumes continue to signal weakness.
The intermediate trend is up.
The primary trend is up.
The intermediate trend is up.
The primary trend is up.
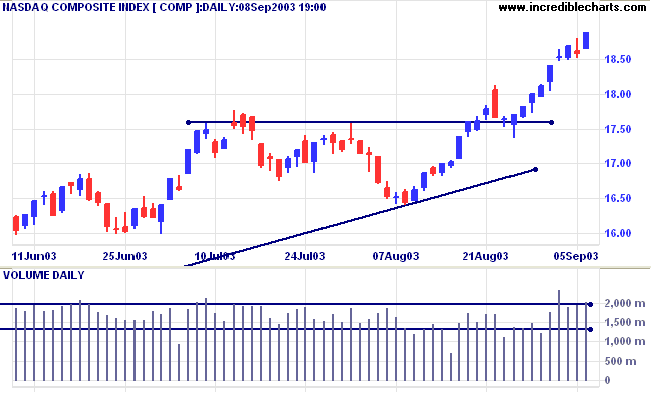
The Nasdaq Composite rallied 31 points to 1889 on strong
volume.
The intermediate trend is up.
The primary trend is up.
The intermediate trend is up.
The primary trend is up.
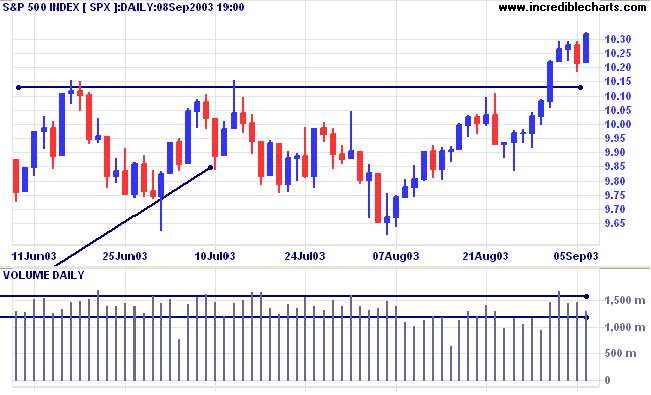
The S&P 500 rallied 11 points to close at 1032. The short
correction signals a fast up-trend but lower volume warns of
susceptibility to selling pressure.
The intermediate trend is up.
The primary trend is up.
The intermediate trend is up.
The primary trend is up.
The Chartcraft NYSE Bullish % Indicator is at a
10-year high of 79.87% (September 8).
Market Strategy
Short-term: Long if the S&P500 is above 1029.
Intermediate: Long if S&P 500 is above 1015.
Long-term: Long is the index is above 960.
Short-term: Long if the S&P500 is above 1029.
Intermediate: Long if S&P 500 is above 1015.
Long-term: Long is the index is above 960.
Treasury yields
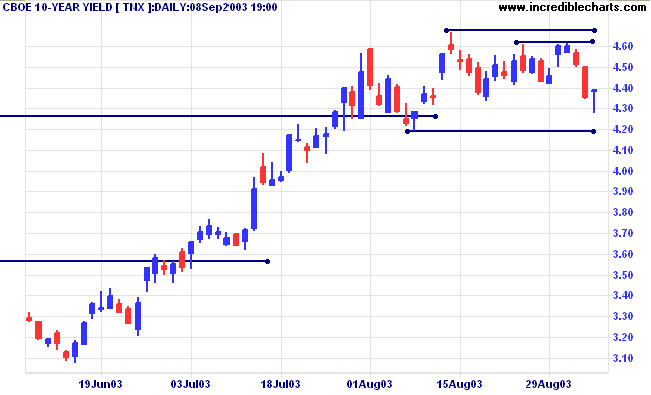
The yield on 10-year treasury notes steadied at 4.39%.
The yield is ranging just above the support level, between 4.67% and 4.20%, a bullish sign.
The primary trend is up.
The yield on 10-year treasury notes steadied at 4.39%.
The yield is ranging just above the support level, between 4.67% and 4.20%, a bullish sign.
The primary trend is up.
Gold
New York (19.30): Spot gold eased to $375.40.
The primary trend is up.
Price has broken above a symmetrical triangle formed since the start of the year. If gold penetrates overhead resistance at 382, the target is the 10-year high of 420.
New York (19.30): Spot gold eased to $375.40.
The primary trend is up.
Price has broken above a symmetrical triangle formed since the start of the year. If gold penetrates overhead resistance at 382, the target is the 10-year high of 420.
ASX Australia
The All Ordinaries gained 13 points to close at 3233. Volume has
dried up during the last 4 days congestion, signaling
continuation.
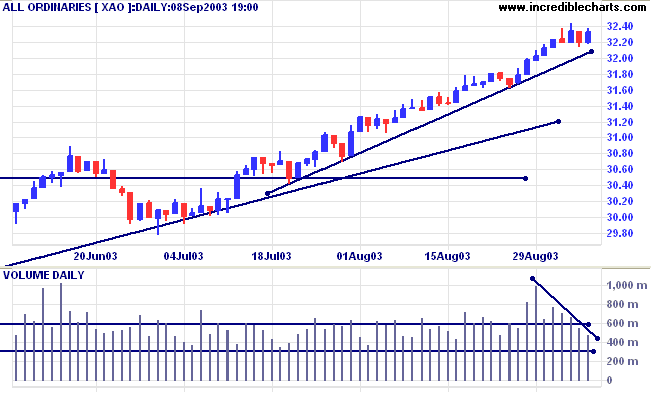
The intermediate and primary trends are up.
MACD (26,12,9) is above its signal line; Slow Stochastic (20,3,3) is below; Twiggs Money Flow shows a bearish divergence.
MACD (26,12,9) is above its signal line; Slow Stochastic (20,3,3) is below; Twiggs Money Flow shows a bearish divergence.
Market Strategy
Short-term: Long above 3238.
Intermediate: Long if the index is above 3160.
Long-term: Long if the index is above 2978 .
Short-term: Long above 3238.
Intermediate: Long if the index is above 3160.
Long-term: Long if the index is above 2978 .
Australian Stock Exchange [ASX]
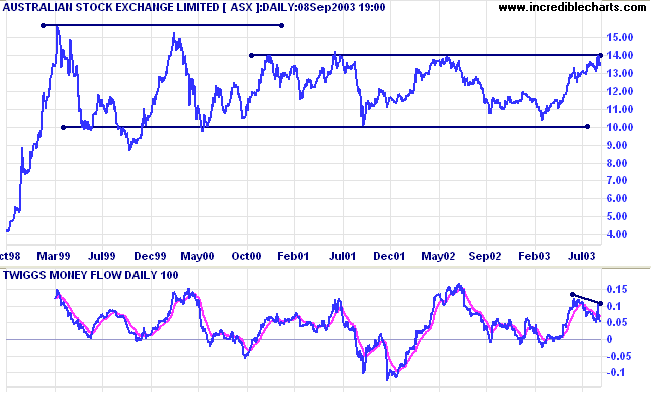
ASX has been ranging between 10.00 and 14.00 for the last 3 years. Price is now testing resistance at the upper border of the range.
Relative Strength is level while Twiggs Money Flow (100) and MACD show bearish divergences.
ASX has been ranging between 10.00 and 14.00 for the last 3 years. Price is now testing resistance at the upper border of the range.
Relative Strength is level while Twiggs Money Flow (100) and MACD show bearish divergences.
On the daily volume chart, exceptional volume at [2] emphasizes
support at 13.00. Strong volume continued with a false break
above 14.00 at [3] and another at [4]. We then have a large gap
down (close down from 13.90 to 13.46) on the day the stock goes
ex-dividend (45.60 cents) with strong volume and a long tail
signaling buying support.
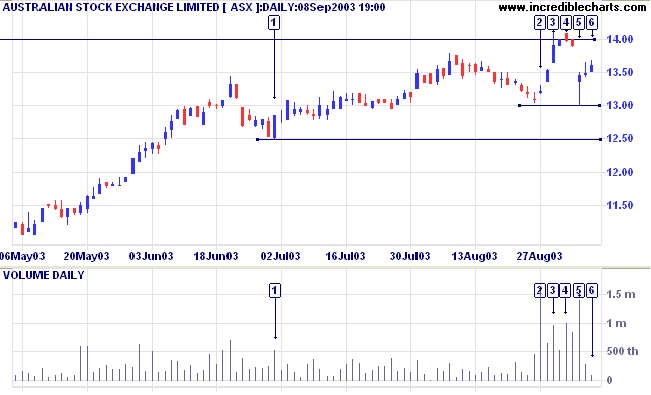
Volume has faded on the rally to [6] and we are likely to see a
re-test of support at 13.00.
A close below 12.50 would be a strong bear signal. A close above 14.00 would be bullish.
A close below 12.50 would be a strong bear signal. A close above 14.00 would be bullish.
Understanding
the Trading Diary has been expanded to offer further
assistance to readers.
Colin Twiggs
Be fearful when others are greedy
and greedy only when others are fearful.
~ Warren Buffet.
and greedy only when others are fearful.
~ Warren Buffet.
Removing Trendlines or Captions
To remove all trendlines or captions from a chart:
To remove all trendlines or captions from a chart:
Right-click on the chart and select Delete
this Chart's Trendlines or Delete this Charts
Captions.
The command can be performed separately on indicator slots.
The command can be performed separately on indicator slots.
Back Issues
You can now view back issues at the Daily Trading Diary Archives.
You can now view back issues at the Daily Trading Diary Archives.
Back Issues
Access the Trading Diary Archives.

Author: Colin Twiggs is a former investment banker with almost 40 years of experience in financial markets. He co-founded Incredible Charts and writes the popular Trading Diary and Patient Investor newsletters.
Using a top-down approach, Colin identifies key macro trends in the global economy before evaluating selected opportunities using a combination of fundamental and technical analysis.
Focusing on interest rates and financial market liquidity as primary drivers of the economic cycle, he warned of the 2008/2009 and 2020 bear markets well ahead of actual events.
He founded PVT Capital (AFSL No. 546090) in May 2023, which offers investment strategy and advice to wholesale clients.