|
Next update One advantage of subscribing to Incredible Charts is that you will never have to purchase a software upgrade: your software is upgraded automatically with each live update. The next update will be available in a few days. The new version offers further improvements to the watchlist menu, powerful new scrolling features and supports the use of Large Font settings on laptop (and desktop) computers. |
Trading Diary
September 5, 2003
The intermediate trend is up.
The primary trend is up.
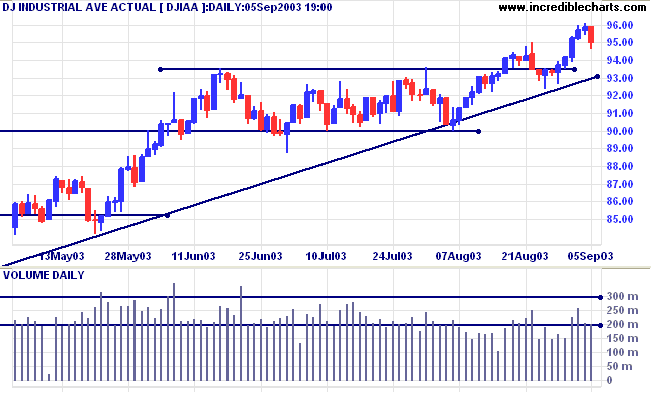
The intermediate trend is up.
The primary trend is up.
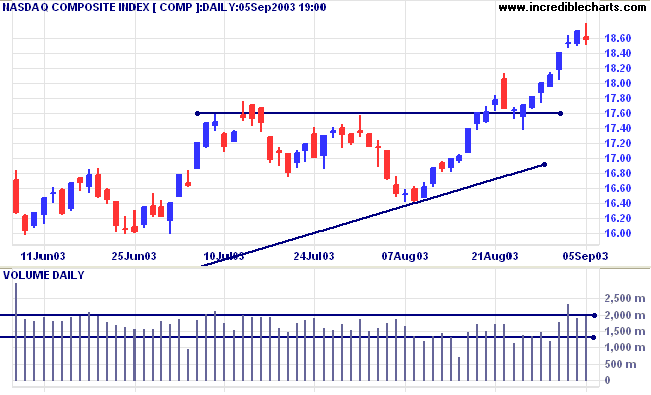
The intermediate trend is up.
The primary trend is up.
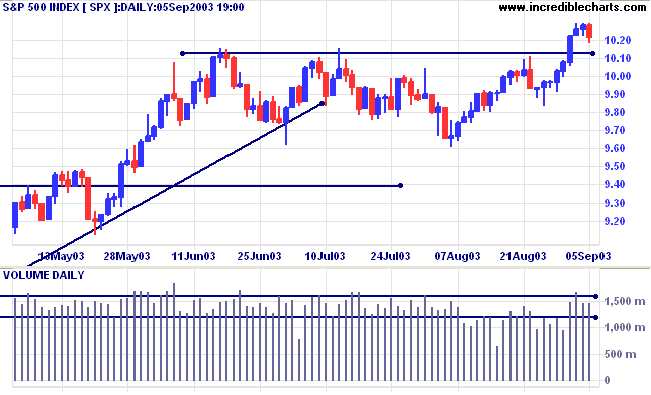
Short-term: Long if the S&P500 is above 1029.
Intermediate: Long if S&P 500 is above 1015.
Long-term: Long is the index is above 960.
The Labor Department announces an unexpected net loss of 93,000 non-farm jobs in August, compared to a loss of 49,000 in July . (more)
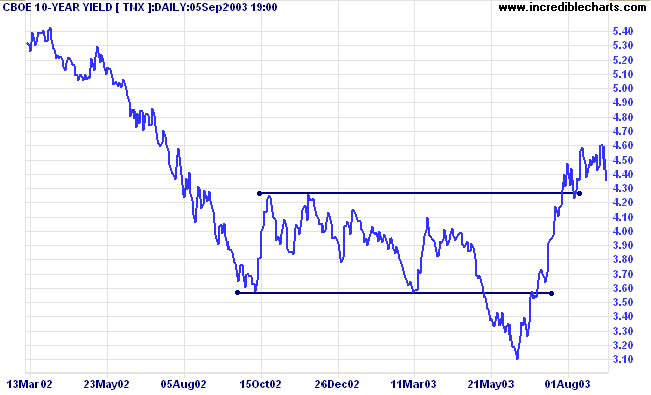
The yield on 10-year treasury notes is down slightly from last week at 4.35% and we are likely to see a test of support at 4.20% to 4.26%.
The intermediate and primary trends are both up.
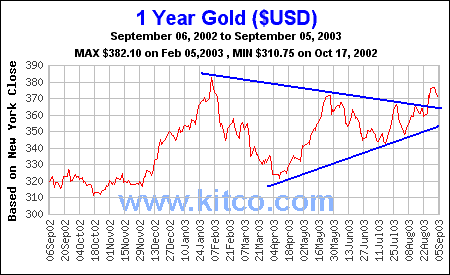
New York (13.30): Spot gold closed the week up slightly at $377.00.
The primary trend is up.
Price has broken above a symmetrical triangle formed since the start of the year. If gold rises above overhead resistance at 382, the target is the 10-year high of 420. The calculated target is 426 (365 + 382 - 321).
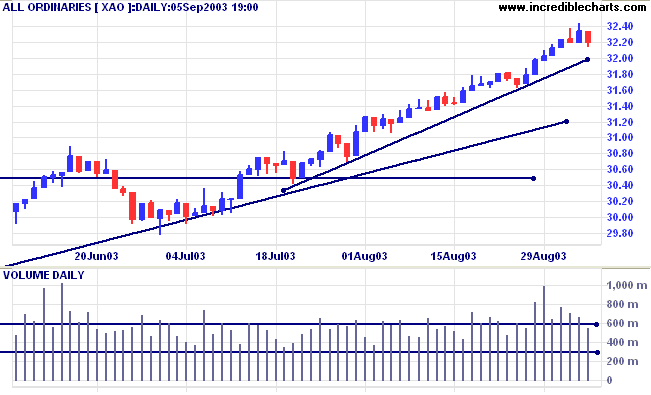
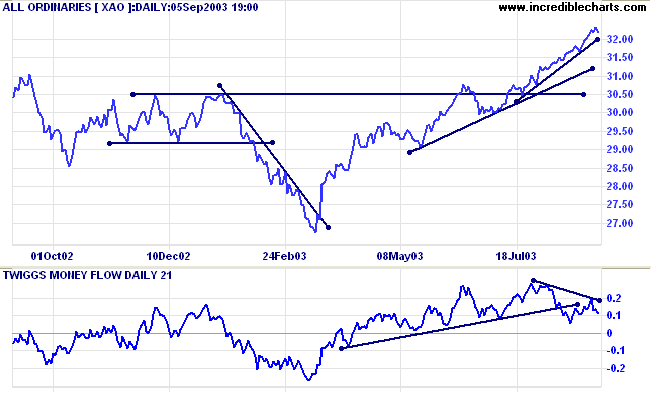
MACD (26,12,9) is above its signal line; Slow Stochastic (20,3,3) is below;
Twiggs Money Flow displays a bearish divergence.
Short-term: Long above 3234.
Intermediate: Long if the index is above 3160.
Long-term: Long if the index is above 2978 .
Changes are highlighted in bold.
- Energy [XEJ] - stage 2 (RS is rising).
- Materials [XMJ] - stage 2 (RS is rising)
- Industrials [XNJ] - stage 1 (RS is level)
- Consumer Discretionary [XDJ] - stage 2 (RS is rising)
- Consumer Staples [XSJ] - stage 1 (RS is falling)
- Health Care [XHJ] - stage 2 (RS is rising)
- Property Trusts [XPJ] - stage 3 (RS is falling)
- Financial excl. Property Trusts [XXJ] - stage 2 (RS is falling).
- Information Technology [XIJ] - stage 2 (RS is rising)
- Telecom Services [XTJ] - stage 2 (RS is level).
- Utilities [XUJ] - stage 2 (RS is falling)
A stock screen of the ASX 200 using % Price Move (1 month: +5%) is steady at 71 stocks (compared to 131 on April 11, 2003; and 8 on March 14, 2003).
- Diversified Metals & Mining (5)
- Gold (5)
- Diversified Commercial (3)
- Construction & Engineering (3)
Stocks analyzed during the week were:
- Autron - AAT
- ERG Limited - ERG
- HPAL Limited - HPX
- Infomedia - IFM
- KAZ Group - KAZ
- SMS Limited- SMX
- Solution 6 - SOH
- Technology One - TNE
- Vision - VSL
- Financial sector - XXJ
- Property sector - XPJ
- Australian Pipeline Trust - APA
- Energy Developments - ENE
- Envestra - ENV
- Gasnet - GAS
- Pacific Hydro - PHY
- Alinta Gas - ALN
- Australian Gas Light - AGL
~ Warren Buffet.
for only
$270
and the Daily Trading Diary (click here for a free sample).
You can now view back issues at the Daily Trading Diary Archives.
Back Issues

Author: Colin Twiggs is a former investment banker with almost 40 years of experience in financial markets. He co-founded Incredible Charts and writes the popular Trading Diary and Patient Investor newsletters.
Using a top-down approach, Colin identifies key macro trends in the global economy before evaluating selected opportunities using a combination of fundamental and technical analysis.
Focusing on interest rates and financial market liquidity as primary drivers of the economic cycle, he warned of the 2008/2009 and 2020 bear markets well ahead of actual events.
He founded PVT Capital (AFSL No. 546090) in May 2023, which offers investment strategy and advice to wholesale clients.
